Show Day/Night Colour Banding
Source: Claude.ai, prompt: "chart.js. I want to show background colours on a line timeseries chart that shows different bg colours based on the time of day (night/day)"
Add a new array item under props.plugins and paste the below into the new item:
{
  "events": [
    "mousemove",
    "mouseout",
    "click",
    "touchstart",
    "touchmove"
  ],
  "id": "dayNightBackground",
  "beforeDatasetsDraw": "(chart) \u003d\u003e {\n    // Helper function to draw a time block\n    const drawTimeBlock \u003d (ctx, xScale, startTime, endTime, color, left, right, top, bottom) \u003d\u003e {\n        const startX \u003d Math.max(xScale.getPixelForValue(startTime.getTime()), left);\n        const endX \u003d Math.min(xScale.getPixelForValue(endTime.getTime()), right);\n\n        if (startX \u003c endX) {\n            ctx.fillStyle \u003d color;\n            ctx.fillRect(startX, top, endX - startX, bottom - top);\n        }\n    };\n    const {\n        ctx,\n        chartArea: {\n            top,\n            bottom,\n            left,\n            right\n        },\n        scales: {\n            x\n        }\n    } \u003d chart;\n\n    ctx.save();\n\n    // Get the time range\n    const minTime \u003d x.min;\n    const maxTime \u003d x.max;\n\n    // Iterate through each day in the range\n    let currentDate \u003d new Date(minTime);\n    currentDate.setHours(0, 0, 0, 0);\n\n    while (currentDate.getTime() \u003c maxTime) {\n        // Night period: 00:00 - 06:00\n        const nightStart \u003d new Date(currentDate);\n        nightStart.setHours(0, 0, 0, 0);\n        const nightEnd \u003d new Date(currentDate);\n        nightEnd.setHours(6, 0, 0, 0);\n\n        drawTimeBlock(ctx, x, nightStart, nightEnd, \u0027rgba(30, 58, 138, 0.1)\u0027, left, right, top, bottom);\n\n        // Day period: 06:00 - 18:00\n        const dayStart \u003d new Date(currentDate);\n        dayStart.setHours(6, 0, 0, 0);\n        const dayEnd \u003d new Date(currentDate);\n        dayEnd.setHours(18, 0, 0, 0);\n\n        drawTimeBlock(ctx, x, dayStart, dayEnd, \u0027rgba(252, 211, 77, 0.1)\u0027, left, right, top, bottom);\n\n        // Night period: 18:00 - 24:00\n        const eveningStart \u003d new Date(currentDate);\n        eveningStart.setHours(18, 0, 0, 0);\n        const eveningEnd \u003d new Date(currentDate);\n        eveningEnd.setHours(23, 59, 59, 999);\n\n        drawTimeBlock(ctx, x, eveningStart, eveningEnd, \u0027rgba(30, 58, 138, 0.1)\u0027, left, right, top, bottom);\n\n        // Move to next day\n        currentDate.setDate(currentDate.getDate() + 1);\n    }\n\n    ctx.restore();\n};\n"
}
Example (banded pale yellow / pale blue vertical bands):
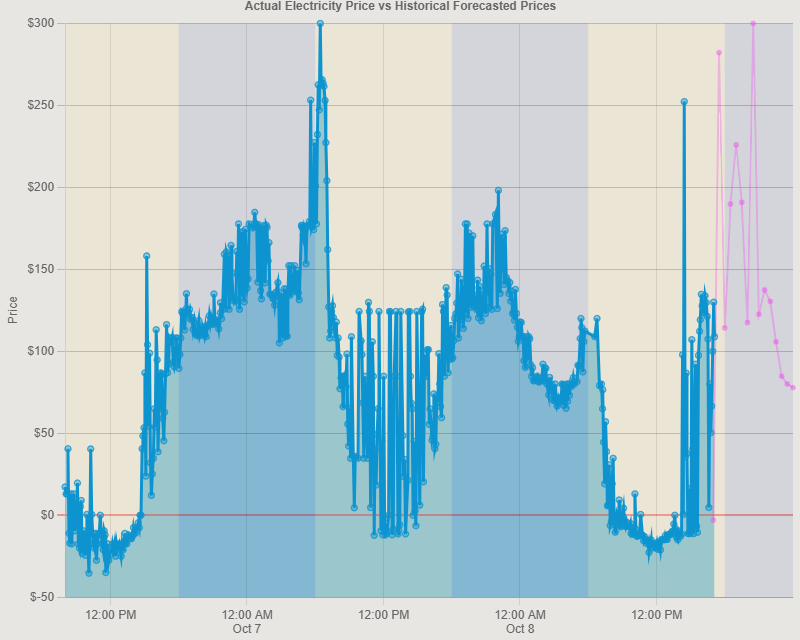
PS. I'm showing the Source of where I derived the solution so that others like me who aren't javascript-fluent can see where I got my solution from! (I haven't written any more than 2% of the code myself)