util_trend.txt (14.4 KB)
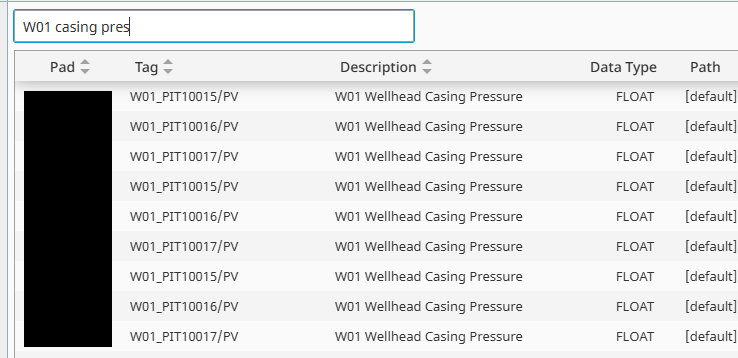
I built something similar that maybe you can use or take parts from? I built it for a table rather than a tag tree browser though but similar functionality to what you’re trying to do. It pulls all the tags into a table, with columns for pad (area), tag name, description, datatype, and path. Then users select a tag from the table and hit add to push it into a powerchart’s pens binding. The textfield does a filter search on everything so they can just type partials of area, tag, desc and filter to that.
- It’s also mostly AI-supported coding but it works perfectly in my application.
- It works for ~thousands of tags. It struggles with > ten thousand tags. A pre-filter by area would certainly improve that.
- I put types of UDTs to include, tag keywords to include as well as tag keywords to exclude to give control over what I do/don’t want in the list.
- Around line 150 there are also overrides for certain tags that have different structures to point them to their correct values, for example in our dual PID UDT there’s two different tag names
Usage wise:
On view startup -> self.view.custom.taglist = util_trend.getTagDataset()

Within the view -> filteredTagList binded to textfield with script transform:
	dataset = self.custom.taglist
	return util_trend.filterTagDataset(dataset, value)