I have an easy chart which I have added chart mode buttons to in order to switch between historical and realtime. Any easy way to allow the user to change one of the pens to its own subplot if they wanted?

I can imagine many ways to go about this. One fun way to do it would be with a template repeater. The repeater's parameter dataset could be bound directly to the easy chart's tagPens dataset. Then a template with a label, plus button, and minus button could be used to manipulate the plot positions. The template's custom properties would need to include the index parameter in addition to 'SUBPLOT'.
These button scripts would then move the subplots for their respective pens:
Plus Button:
# Written for the actionPerformed event handler of the PLUS button
# Import SwingUtilites and TemplateRepeater classes, and use them to find the parent templateRepeater
from javax.swing import SwingUtilities
from com.inductiveautomation.factorypmi.application.components import TemplateRepeater
templateRepeater = SwingUtilities.getAncestorOfClass(TemplateRepeater, event.source)

# If the parent template repeater is found, get the corresponding easy chart and calculate the next larger plot number
if templateRepeater:
	newPlot = event.source.parent.SUBPLOT + 1
	easyChart = templateRepeater.parent.getComponent('Easy Chart')

	# Verify that the new plot is valid, and if so, apply it
	if newPlot < easyChart.subplots.rowCount:
		easyChart.tagPens = system.dataset.setValue(easyChart.tagPens, event.source.parent.index, 'SUBPLOT', newPlot)
Minus Button:
# Written for the actionPerformed event handler of the MINUS button
# Import SwingUtilites and TemplateRepeater classes, and use them to find the parent templateRepeater
from javax.swing import SwingUtilities
from com.inductiveautomation.factorypmi.application.components import TemplateRepeater
templateRepeater = SwingUtilities.getAncestorOfClass(TemplateRepeater, event.source)

# If the parent template repeater is found, get the corresponding easy chart and calculate the next smaller plot number
if templateRepeater:
	easyChart = templateRepeater.parent.getComponent('Easy Chart')
	newPlot = event.source.parent.SUBPLOT - 1

	# Verify that the new plot is valid, and if so, apply it
	if newPlot >= 0:
		easyChart.tagPens = system.dataset.setValue(easyChart.tagPens, event.source.parent.index, 'SUBPLOT', newPlot)

Another [perhaps simpler] way to do it, would be to use a dropdown component.
Then, the selected index of the dropdown could be used by plus or minus buttons to manipulate the easychart pens dataset.
A script similar to this could be used to auto populate the dropdown:
# Get the pens dataset
tagPens = event.source.parent.getComponent('Easy Chart').tagPens

# Define the value and label columns for the dropdown
headers = ['SUBPLOT', 'Name']

# Get the subplot and names as a list of lists
data = [[tagPens.getValueAt(row, 'SUBPLOT'), tagPens.getValueAt(row, 'NAME')] for row in xrange(tagPens.rowCount)]

# Assemble the headers and data into a dataset and assign it to the dropdown
event.source.parent.getComponent('Dropdown').data = system.dataset.toDataSet(headers, data)
The button scripts would look like this:
# Get the pens dataset
tagPens = event.source.parent.getComponent('Easy Chart').tagPens

# Identify the selected index
selectedIndex = event.source.parent.getComponent('Dropdown').selectedIndex

# Don't attemp this if nothing is selected or if the selected index exceeds the length of the pens table.
if selectedIndex > -1 and selectedIndex < tagPens.rowCount:

	currentSubplot = tagPens.getValueAt(selectedIndex, 'SUBPLOT')
	newSubplot = currentSubplot + 1 # or minus if this were the minust button

	# Make sure the new subplit is valid and apply it to the pen
	if newSubplot < tagPens.rowCount:# or newsubplot >= 0 if this were the minust button
		event.source.parent.getComponent('Easy Chart').tagPens = system.dataset.setValue(tagPens, selectedIndex, 'SUBPLOT', newSubplot)

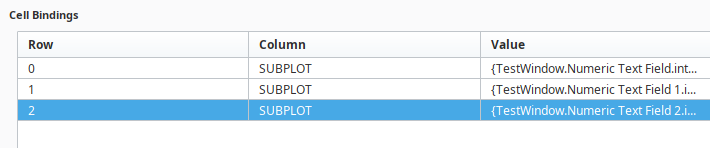
Another way would be to use a cell update binding on the pens dataset to control the plot values in conjunction with numeric text fields that have their minimum and maximum values representing the number of plots. This way, invalid entries couldn't be made that would break the binding:

I suppose the numeric textfield could alternatively be thrown into a template and a template repeater used to keep the number of textfields and their respective locations dynamic. Then, scripting could be used instead of a binding to write the subplot value, but I imagine at this point there are enough examples in this post to find inspiration or direction.
Great examples! I think the cell update binding would be the easiest for me.
I mean, sure, but why not just use the JFreeChart's actual Subplot feature?
All you have to do is write a number other than 1 into the SubPlot value of the Pen.
A lot less intensive than a template repeater.
Nevermind, I should read before I reply. Ugghhh
COFFEE!!! Anyone???