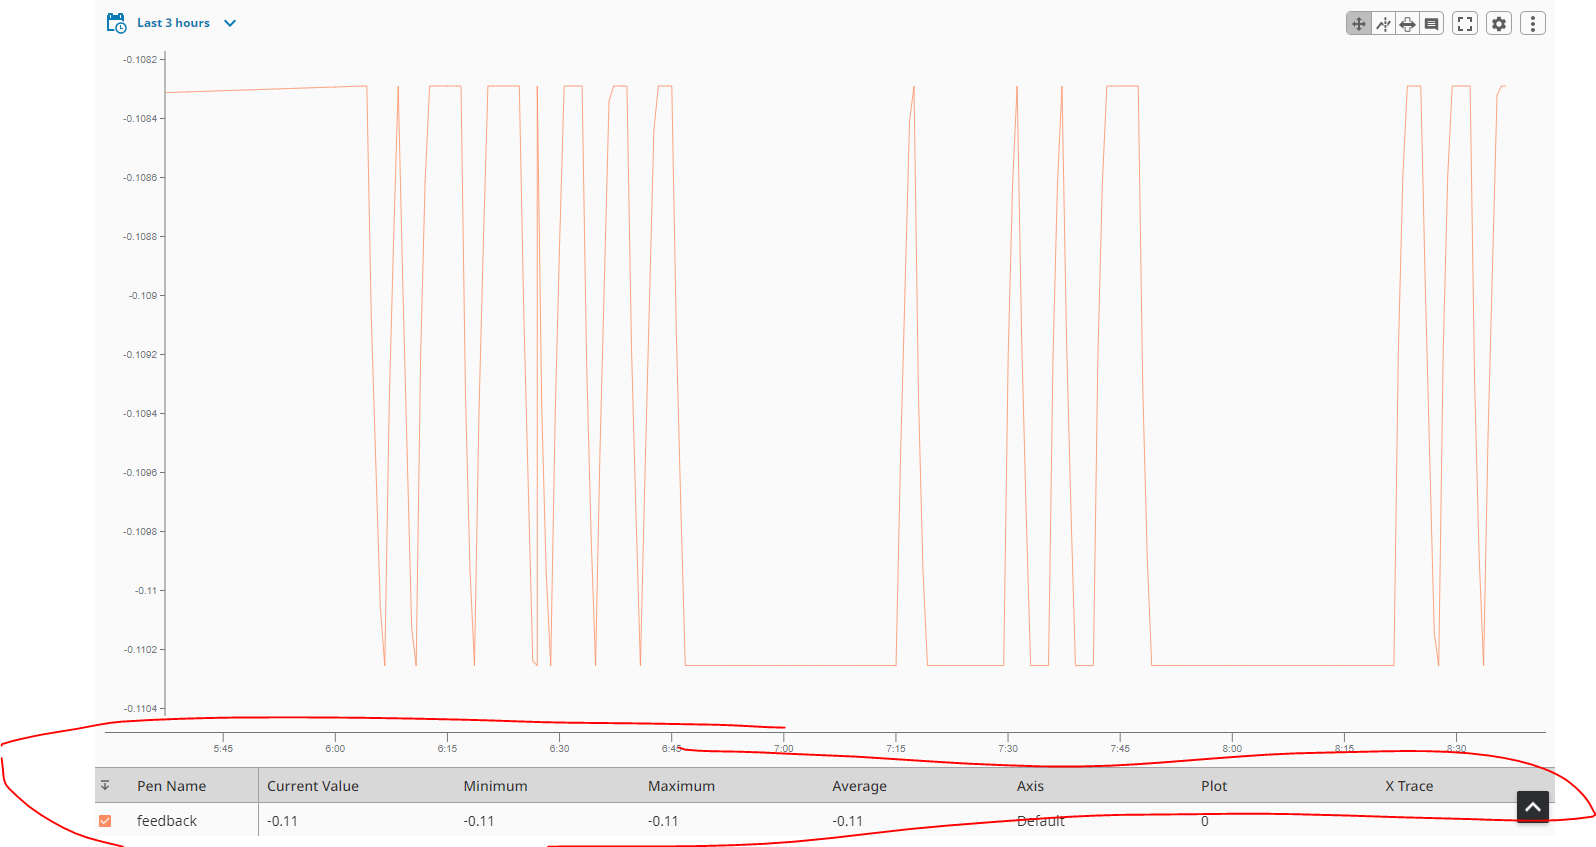
I am using the adhoc trending tool which is on Ignition Exchange. I would like to add a column to the pen Control which shows a description of the tag which is being plotted.
For Example:
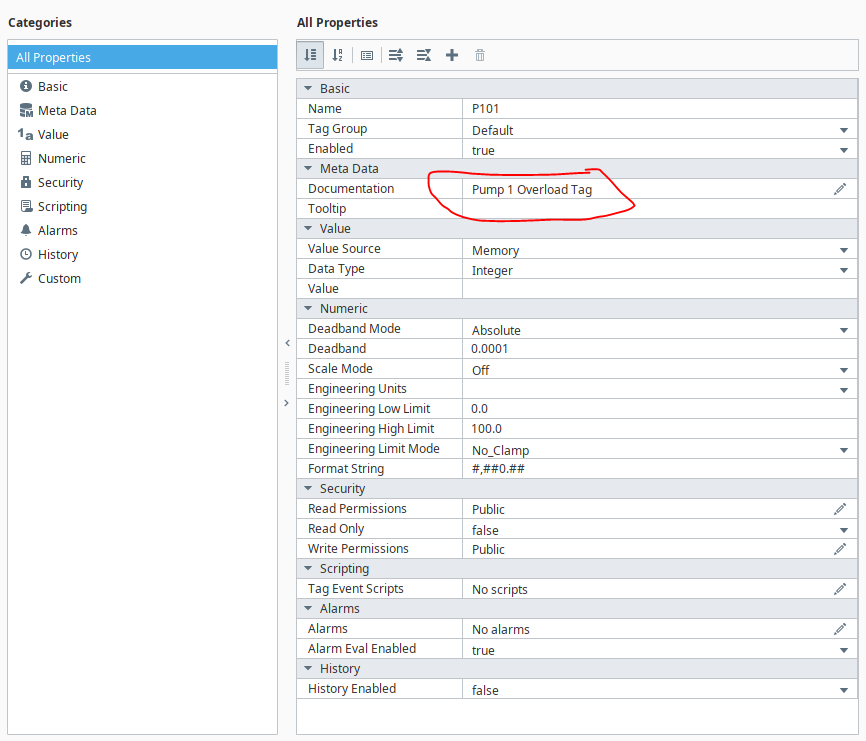
I want to show the documentation meta data for the tag which shown in tag editor below on the pen control table:
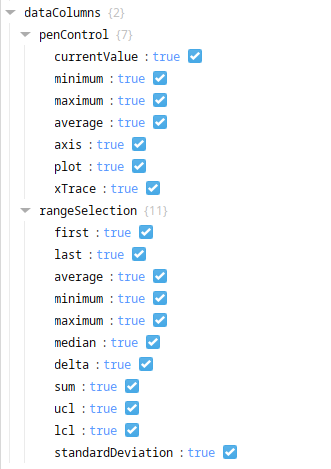
It seems that I have to add it to the penControl property under dataColumns which is associated to the powerChart:
However, when I add anything under the property, I get the following error:
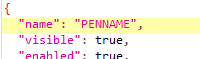
dataCoulmns.penControl.documentation: is not defined in the schema and additional properties are not allowed.
FYI: i called the added property "documentation"
Has anyone been able to achieve this?
I have done this in the vision Adhoc trend but cannot do it on perspective.
Seems like adding additional columns to the table is not supported.
We built a custom tag browser to add pens to the chart, and construct the pen name in the script that appends a new pen to the pens prop. In your case you would read the tag description to get the pen name.
Thank you
I am assuming you used the powerChart component but set the visibility property "showTagBrowserButton" to false. Then, you added a "Tag Browse Tree" component on the screen and used a button to add the pens to the chart. What is the command you used to add pens to the chart?
For adding pens to the power chart, we did something along these lines: pens.append(newPen), where pens is the pens property on the powerchart, and newPen is a dictionary.
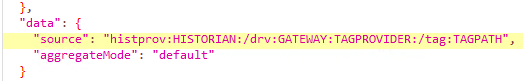
If you right-click on on an existing pen in the properties on the powerchart and copy it, you can then paste it into a script as a dictionary and modify it from there. You'll have to construct the historical path for it to work with the historian: