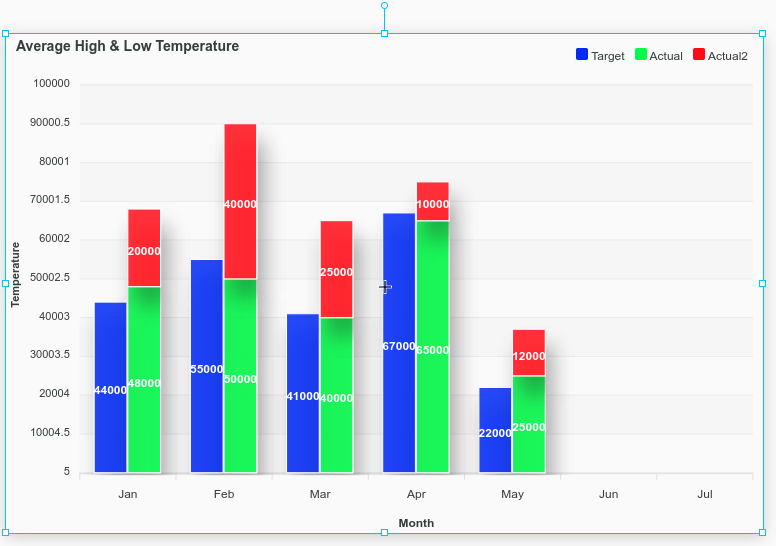
You need to have unique names for every item in the group (e.g. Actual1 and Actual2). If they are the same name, they overlap instead of stack.
If you still have issues, you can copy/paste you chart into the thread and we can take a closer look. 
[
  {
    "type": "kyvislabs.display.apexchart",
    "version": 0,
    "props": {
      "type": "bar",
      "options": {
        "chart": {
          "dropShadow": {
            "blur": 10,
            "color": "#000",
            "enabled": true,
            "left": 7,
            "opacity": 0.2,
            "top": 18
          },
          "height": 350,
          "toolbar": {
            "show": false
          },
          "type": "line",
          "events": {
            "animationEnd": false,
            "beforeMount": false,
            "mounted": false,
            "updated": false,
            "mouseMove": false,
            "mouseLeave": false,
            "click": false,
            "legendClick": false,
            "markerClick": false,
            "xAxisLabelClick": false,
            "selection": false,
            "dataPointSelection": false,
            "dataPointMouseEnter": false,
            "dataPointMouseLeave": false,
            "beforeZoom": false,
            "beforeResetZoom": false,
            "zoomed": false,
            "scrolled": false,
            "brushScrolled": false
          },
          "stacked": true
        },
        "colors": [
          "#0000FF",
          "#00FF00",
          "#FF0000"
        ],
        "dataLabels": {
          "enabled": true
        },
        "grid": {
          "borderColor": "#e7e7e7",
          "row": {
            "colors": [
              "#f3f3f3",
              "transparent"
            ],
            "opacity": 0.5
          }
        },
        "legend": {
          "floating": true,
          "horizontalAlign": "right",
          "offsetX": -5,
          "offsetY": -25,
          "position": "top"
        },
        "markers": {
          "size": 1
        },
        "stroke": {
          "width": 1,
          "colors": [
            "#fff"
          ]
        },
        "title": {
          "align": "left",
          "text": "Average High & Low Temperature"
        },
        "xaxis": {
          "categories": [
            "Jan",
            "Feb",
            "Mar",
            "Apr",
            "May",
            "Jun",
            "Jul"
          ],
          "title": {
            "text": "Month"
          }
        },
        "yaxis": {
          "max": 100000,
          "min": 5,
          "title": {
            "text": "Temperature"
          }
        }
      },
      "series": [
        {
          "name": "Target",
          "group": "target",
          "data": [
            44000,
            55000,
            41000,
            67000,
            22000
          ]
        },
        {
          "name": "Actual",
          "group": "actual",
          "data": [
            48000,
            50000,
            40000,
            65000,
            25000
          ]
        },
        {
          "name": "Actual2",
          "group": "actual",
          "data": [
            20000,
            40000,
            25000,
            10000,
            12000
          ]
        }
      ]
    },
    "meta": {
      "name": "apexchart"
    },
    "position": {
      "x": 8,
      "y": 165,
      "width": 757,
      "height": 499
    },
    "custom": {}
  }
]