Hello, I would like to kindly request assistance regarding an issue I am encountering with the Kyvis ApexChart module in Ignition Perspective.
Thank you very much in advance for your time and assistance. I truly appreciate any guidance or suggestions you may offer.
Objective
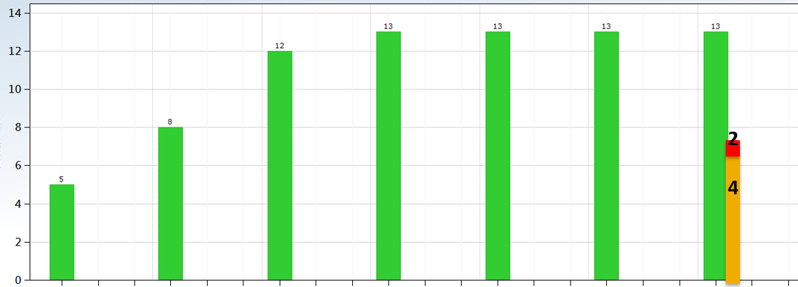
I am attempting to display two distinct bar groups for each date on the X-axis:
-
Left bar (single, green):
Representstotal_open_cnt. -
Right bar (stacked, orange + red):
Represents-
total_unassigned_cnt(orange) -
total_overdue_cnt(red).
-