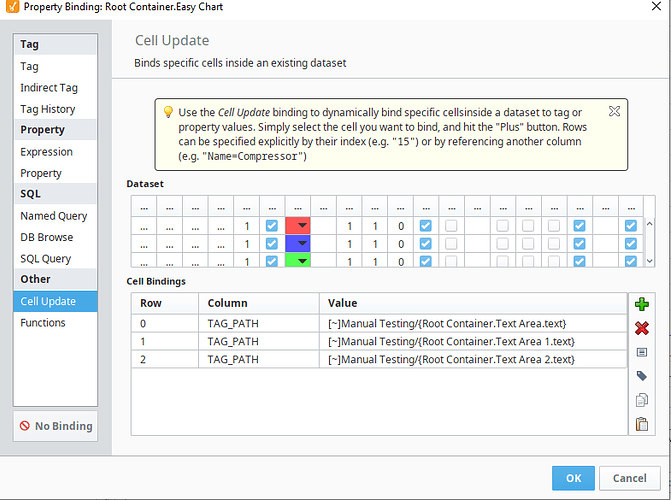
Hi All,
Has anyone of you dealt with the easy chart or any other graph or data trend viewing options? I want to filter the input data I want to see, and I have been able to filter the input data as well. however, the names (like the name of variable whose data is displayed) does not change, even though the data va;ue changes?
ANy help will be great.
This is what I mean… see the pens? Their name never changes (Label 1…5 etc in this case), where as when I change the input value, the value on the graph does change.


