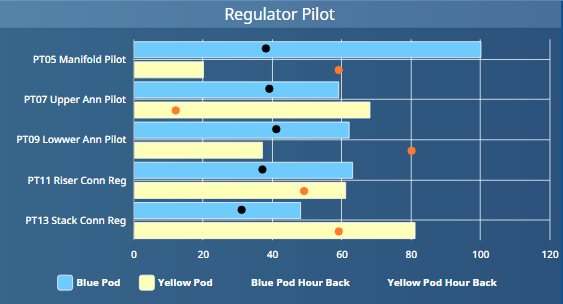
I have made the below chart, but I am not sure how to get the little black and dark orange markers to appear ontop of the bars. The markers are for values associated with the corresponding bar but change independently. (It's similar to a stacked bar but instead of stacked it is just a line that goes over the bar)
Below is an image of what I am replicating:
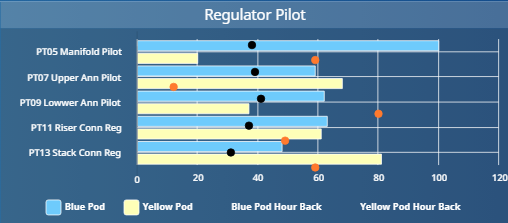
Below is an image of what I have made so far:
Here is an update on where I have gotten to.
I need to offset the black and orange dots to overlay the bars.
I used a step line without the line to achieve the dots.
Here is an update on my progress.
I only need help ensuring the graphs stay in position when resizing
I used a percentage-based fixed container with 3 charts on top of each other to achieve this effect so far.
Intended look:
While being scaled:
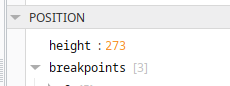
Maybe you can try define a fixed height, so it doesn´t scale