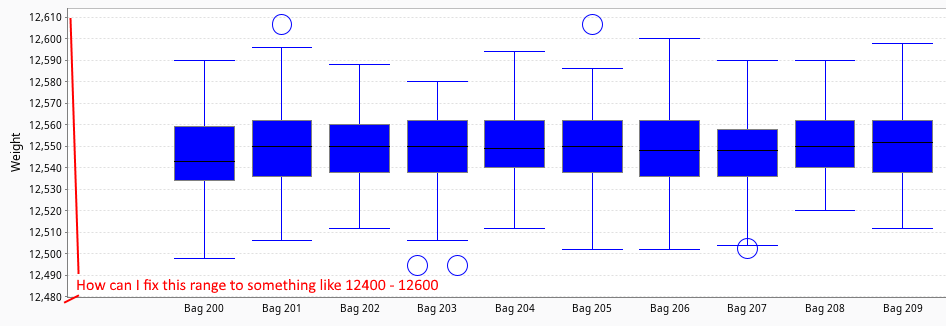
I have multiple Box and Whiskers charts that I would like to compare, but the Axis is Auto-Ranged so it varies slightly for each chart. Is there a way to fix the Range so that they can be compared easily?
Thanks,
chartComponent = event.source.parent.getComponent('Box and Whisker Chart')
chart = chartComponent.getChart()

plot = chart.getPlot()

axis = plot.getRangeAxis()
axis.setRange(12400,12600)
Great! Works perfectly.
Thanks jpark
Is it possible to “fix” the AutorangeIncludeZero on this component ?
I would like to display 2 datasets (composed of 2 values each) with, for example, input/output temperatures and input/output flow.
Here is my dataSet :

The columns are bound to tags changing every 10 seconds with a Cell Update :

I’ve put this script in a button :
chartComponent = event.source.parent.getComponent('Box and Whisker Chart')
chart = chartComponent.getChart()

plot = chart.getPlot()

axis = plot.getRangeAxis()
axis.setFixedAutoRange(0)
axis.setAutoRangeIncludesZero(1)
axis.setAutoRangeStickyZero(1)
When i press the button, the AutorangeIncludesZero is well executed but as soon as the binding on the values is evaluated, the zero disapears and the range does not include zero. It is like the “default” parameter for this component was Auto Range does not includes Zero.
I tried binding one of the tags used in the Cell Update to a custom property on the Root Container and execute a Property Change Script on this custom property but it didn’t work.
Any help ?