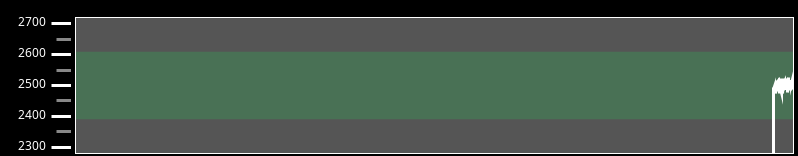
I’m using a sparkline chart in vision to display realtime tag history data. When I begin a test cycle the incoming data on the sparkline all seems to pile up at the right side of the chart and after some time will then jump and display the data properly. I cannot seem to find the issue. Below I have included pictures of the chart before and after the “jump”. Also, I have included a picture of my data bindings.


I was able to reproduce this on 8.1.13, but only one time. I am not sure exactly what exactly caused the described behavior though. I added a spark line chart, added a real time tag history, forgot to set a value for most recent and tried to save. That threw an error so i canceled out, read the error and then configured the real time tag history as you have. I had history disabled on this particular tag, which i then enabled.
I’m currently on 8.1.12, and this is happening almost every single time I run a test cycle. I may consider using a different chart component if I cant’t find a fix. I’ll check it out again next time we update our FPMI version.