In the third screenshot, you'll see that I can pull up several days worth of data as long as the data is from before Feb 12th, where the data turns into a straight line (which goes away when I turn off "Allow Tag History Interpolation").
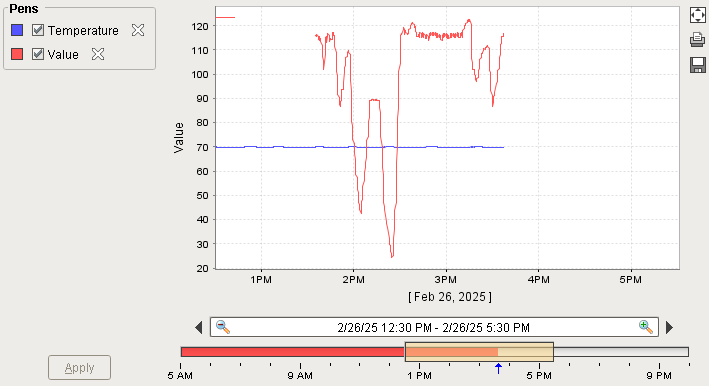
There is tag history data, I can see it when I reduce the time interval (or zoom in). It just thinks there isn't any when trying to display data after the 12th. I thought maybe the queries were timing out or something but for older data I can query for a week's worth of data with no issues.