Hi All,
Up until today, I’d had no issues with high CPU usage and was developing my project with 1GB RAM on the gateway. Today, I started noticing the designer became very slow while I was trying to build a new simple View in perspective. No scripts or new OPC connections or anything related with databases… After restaring the PC a couple of times, I started checking the performance, increased the memory to 2GB and the usage kept peaking.
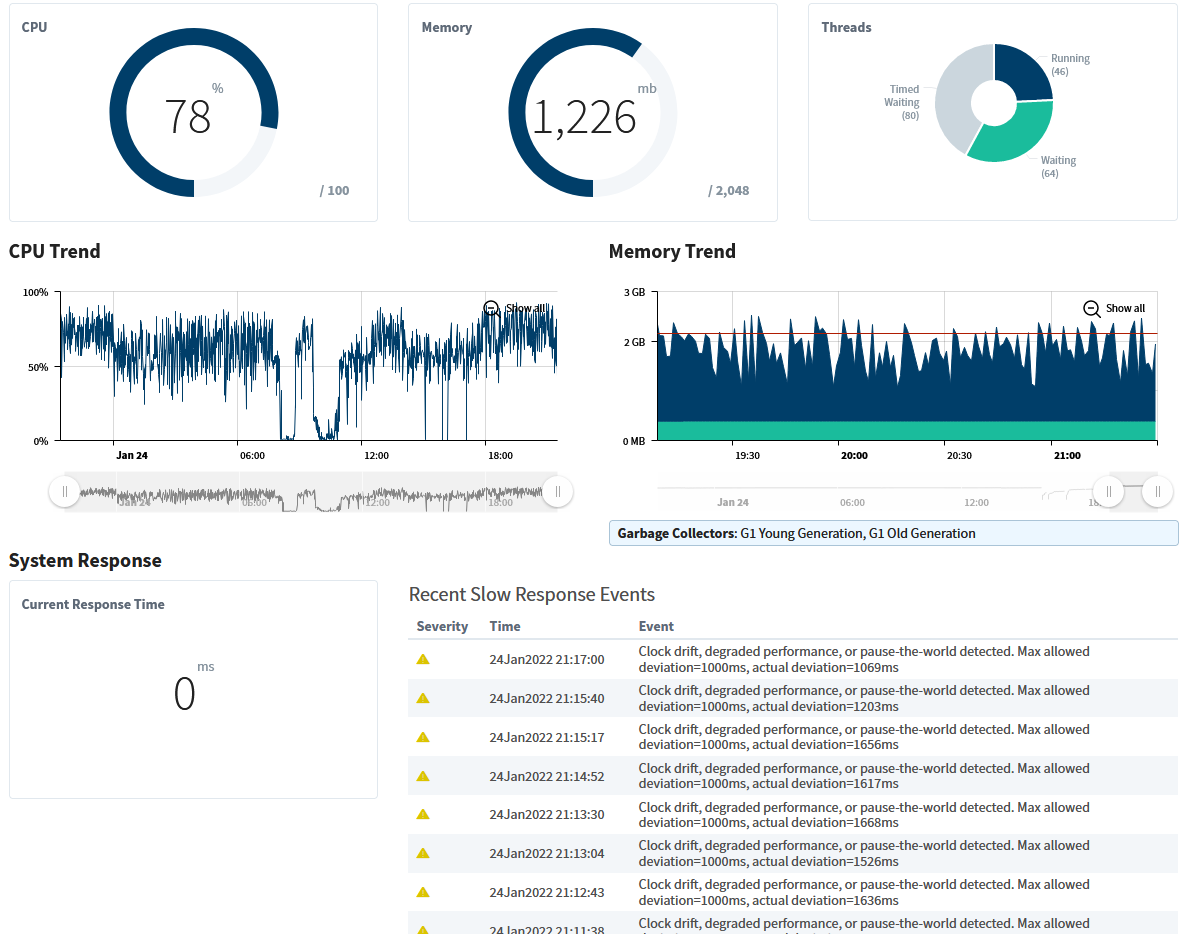
Trying to eliminate any bugs on my project, I disabled it and ALL other projects so at the moment the gateway is not running any projects at all or serving any client sessions. Still the CPU keeps peaking to 90% and memory usage to max.
I also have continuous clock drift errors.
I have read all articles in forum and support associated with clock drift and even changed the GC parameter to 100 as one of the recommended with no changes whatsoever.
At this point, if the gateway is not executing anything at all, what would be my next step in troubleshotting? where can analyze what other processes might be keeping the gateway so busy, literally all of a sudden?
Thanks a lot!
unning:
Ignition 8.1
Java 8 (build 1.8.0_321-b07)
Look at what else is running in the operating system. Is this an environment where database, gateway, designer, and client are all on the same machine? If so, with 2G allocated to Ignition, the server probably needs a total of 32G or more. (In other words: don’t do that.)
Phil thanks for the suggestions. As I mentioned, the development is at a very early stage and for a few weeks I didn’t have this issue, even running with 1GB RAM!
In my PC task monitor the CPU usage was coming from Zulu Platform which in my case is only used by Ignition platform.
What I really didn’t understand is why the gateway activity was so high in CPU and memory if all projects were disabled. That should mean no scripts are being executed, no queries, no one is calling any of the third party modules… So I wanted to see if there are any tools that allowed me to dig into what was going on with the gateway, like an internal Ignition process monitor. Still would like to know this.
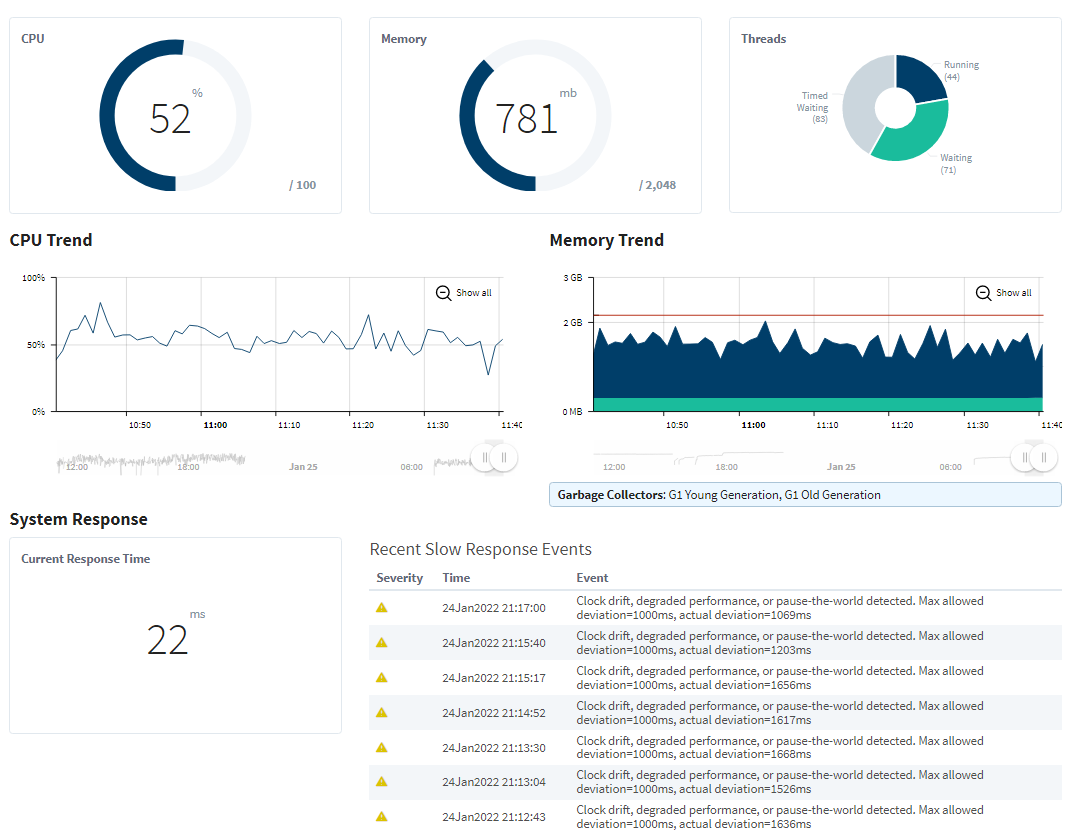
Anyways, last night I manually stopped Ignition server for the night, this morning, restarted everything, started the service again and activated my project and the cpu and memory were back to normal and I haven’t had any clock drifts events since. No idea why. No changes to project at all.
My problem went away (I’m happy), but it’s still a mystery what happened. (I’m worried)
If it happens again get a thread dump.
Hell, get one now, even. >50% CPU usage and all those clock drifts should be justified somehow…
Kevin, this is a thread dump from a few minutes ago. The CPU is kind of up again.
Is there any keywords or particular type of events that would indicate a culprit on this file?
I know there are many potential factors for this behavior and they are all documented, so I am not expecting to get the answer to my specific problem here, but rather some guidance on how to dig into this data to find it. Appreciate all the help.
file.txt (60.5 KB)
This seems to be a thread dump from the client/designer, not the gateway. You’ll need to get one from the Diagnostics > Threads page: Diagnostics - Threads - Ignition User Manual 8.1 - Ignition Documentation
Sorry. Here it goes.
From my threads screen, I see top 5 CPU eaters are MES Live Analysis, so I have a starting point now. Thanks!
Ignition-LAPTOP_thread_dump20220125-144103.json (231.0 KB)