Hi All,
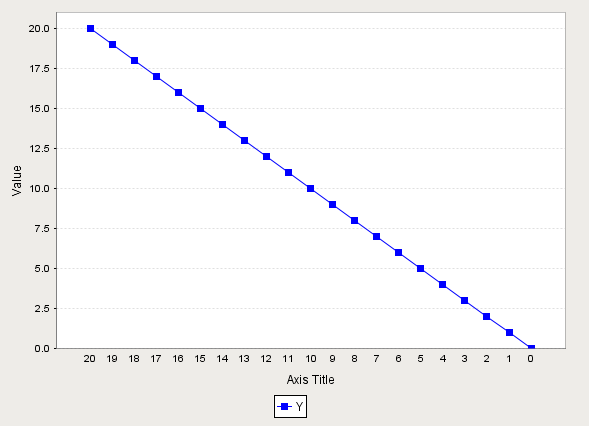
Is there a way to have a contrariwise Chart’s X axis?
I have two charts. One is displaying the rise of a variable ( from 0 to 50 degrees ) and the other chart should display the fall of the same variable ( from 50 to 0 degrees ) but I can’t find a clean way to reverse the X axis in order to have it from 50 to 0.