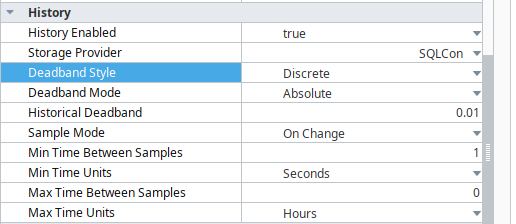
I have tag history setup for a tag that toggles true once a cycle is completed.
How can I use “Tag History” under binding to show how many times this tag turned true in an hour? I would like to show plot this to show performance. Even better would be to show this in 15min interval and multiply by 4 to show higher resolution.
I would like the data to be something like:
time - qty/hour
07:00 - 12
07:15 - 15
07:30 - 10
07:45 - 11
08:00 - 12

