Hello, I’m trying to display the status of multiple tags that have tag history. the idea is to display only the tags when the value it’s true but they are being display even when not true. and to display them on a time graph. but so far the closest i have got is with the easy chart I put the pens as bars, but still don’t get the result I want.
The pictures below its a sample of two tags. those to tags are never true time. never. so they should be shown like the are as you can see below it is not correct. and i check the DB to make sure they are never true at time. Value of this tags its only 1 or 0. but this shows more
Easy chart

Also below another picture showing 4 tags and the result its also incorrect.

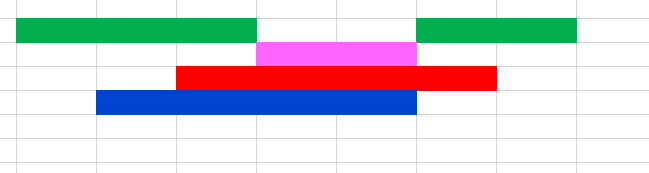
Ideal Result would be something like this, I did this in Excel I use the colors of the pens to show the example. any ideas? thanks in advace