Hi Everybody
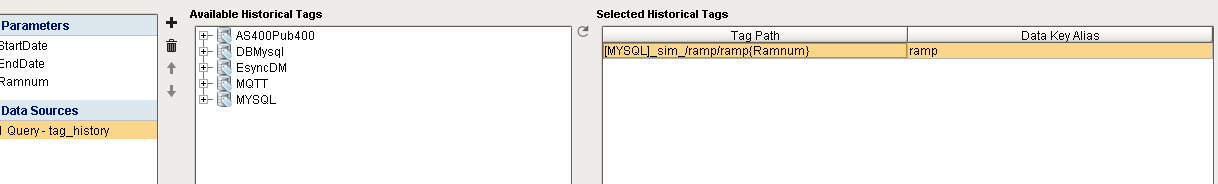
I need create a report with a time-series chart , with dynamic history pens.
I created a parameter for to pass coreectly the name of the pen , but I don’t find the right syntax to create the dynamic label for the pen.
which is the right syntax to put in the Pen Name parameter?
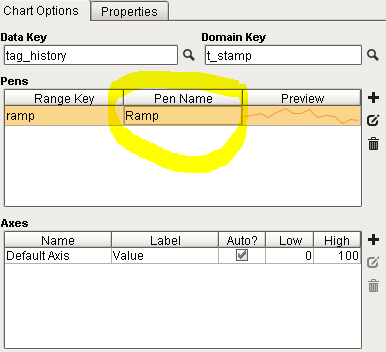 ( see picture below)
Thank you very much
Andrea
There isn’t a way to dynamically label the pens in a report, but it is possible using the configureChart extension function. Here’s a small example showing how to extend the JFreeChart objects:
	from org.jfree.chart.labels import StandardXYSeriesLabelGenerator
	plot = chart.getPlot()
	renderer = plot.getRenderer()

	class customLabelGenerator(StandardXYSeriesLabelGenerator):
		def __init__(self):
			self.count = 0
		def generateLabel(self, dataset, series):
			self.count += 1
			return 'Test %s' % self.count

	renderer.setLegendItemLabelGenerator(customLabelGenerator())