This is really three feature requests, one to arrange the labels on the legend so that they correspond to the trend position in the subplots.
the second is to make a true isolated graphing mode available without having to create multiple subplots
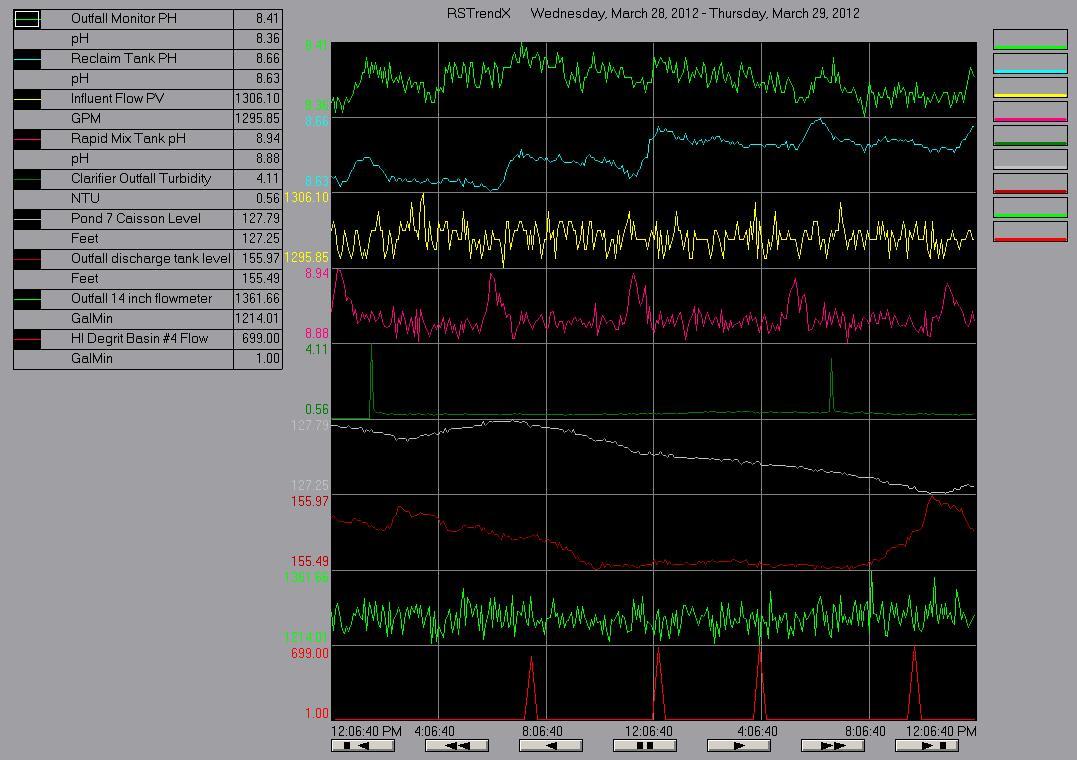
For example, on RSView32 we make extensive use of isolated graphing. This mode is not available in the Ignition Easy Chart Control but provides a quick and easy way of viewing trends with radically different scales (i.e. flow = 0-2000 GPM, ph = 7-10 pH) on the same plot. The nice thing about this is that the legend created by the RSView32 trendx control has the tag descriptions listed in the same order as the trends on the plot. This means that the plot is still discernable if you print the trend to black and white
Conversely if you create an easy trend the legend will list the pens in alphabetical order, so you need to juggle the sub plot order to try and get the legend labels and the trends to match. This leads to some not so logical orderings of sub plots. Perhaps a better way of doing it would be to order the labels on the legend by sub plot position first and then by alphabetical order.
Yes I could just place my own legend box in but this is a pain and it would be nice if it just ‘worked’ right in the first place.
Alternatively you could provide an isolated graphing checkbox to allow the trend to act in the same way as Trendx (i.e. without configuring subplots), this way the trend legend could just display them as they appear. A way of moving trends up and down in their order would have to be provided.
Third feature request:
The use of subplots currently uses quite a lot of screen real estate (I’m talking about the 5 pixels or so between sub plots). This isn’t really functional and consumes space which becomes an issue when you are trying to squeeze a small plot with 2-3 subplots on it into a small area. If this could be eliminated this would be great (just a one pixel line is fine).
You can already create multiple axis with very different scaling and place as many as you want on either the left or right side of a chart. This might mitigate the requirement for many subplots. Are you familiar with what I’m describing? You can also uncheck the (expert) “Alphabetize pens”, which will list pens in the order that you added them (I don’t know of any practical way of re-ordering).
I’m interpreting your request as the following:
Option to reorder the pens in the legend. Perhaps the ability to group them based on Axis or subplot.
Option to adjust the spacing between subplots. The scale may overlap, but that’s up to your design.
Does this cover what you’re looking for? I don’t understand the “TrendX alternative” you’re describing. Could you elaborate?
Thanks for the reply. Yes I’m familiar with what you are describing.
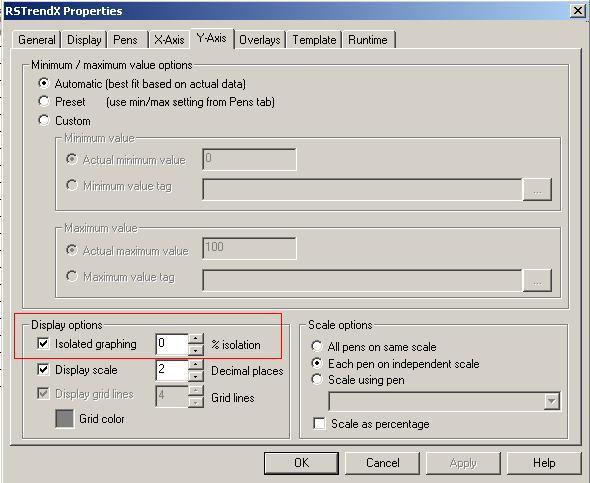
The ‘trendx alternative’ is basically a method in RSTrendx of selecting an ‘isolated graphing’ checkbox and the trends are automatically displayed on their own subplots with auto scaling (exact scaling can be overridden using the pen configuration). This requires no subplot specification.
Yes you have more control with the way Ignition does things but RSTrendX is quicker in terms of being able to put trends together although lacking things like sub plot relative weighting etc.
Also the RSTrendX equivalent of xtrace gives all values across all subplots which would be great to see in Ignition (I think there is already a feature request out there)
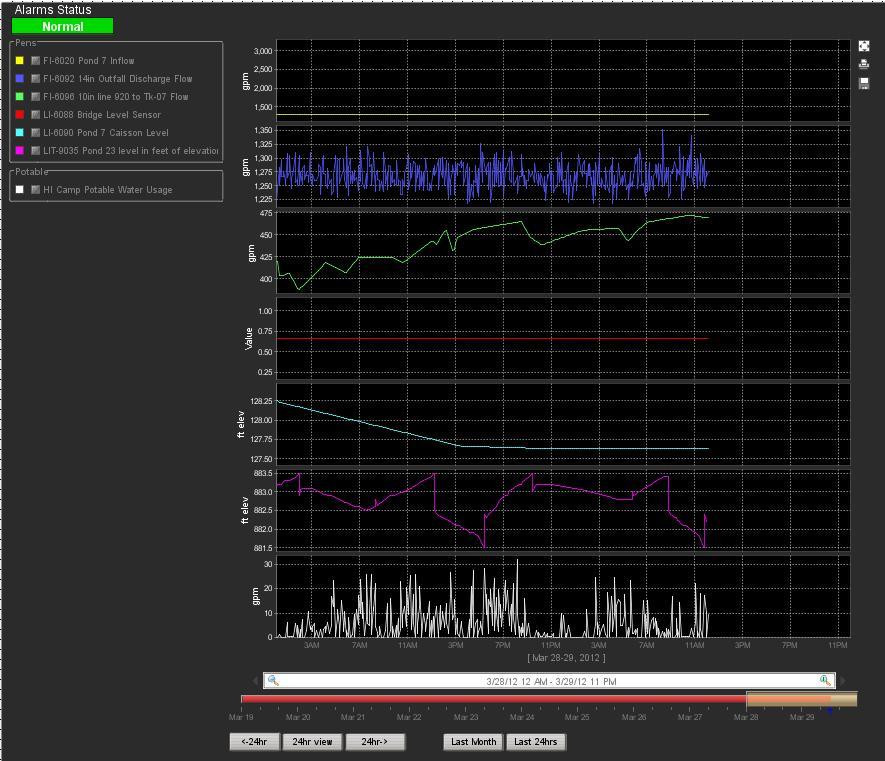
For for early 2000s era software RSTrendX is actually pretty slick! I’ve included some screen shots of RSTrendx trends, config, and Ignition subplots to illustrate this.
That reminds me of another feature request I put in to delink the xaxis font and legend label color from the time scale selector box. What a pain for dark backgrounds! (Notice the grey font I am forced to use in the Ignition trend screen shot)
I do remember configuring trends in the late 90s / early 2000s with RSView/RSTrendX. It is pretty handy for the options provided. The problems I had were with data archiving (it slowed down significantly with increasing data sets) and multiple terminals (data was stored on the local hard drive). It would be nice if Easy Chart usability features make it as a priority of 7.5. You may be able to affect this based on threads where other users agree since the demand is user driven. Here is my take:
“Isolate Graphs”. An Expert property of the Easy chart that, when enabled, divides the chart into n even subplots, where n is the pens. I recommend not overriding axis settings, except making all axis labels appear on the left side. It seems like an odd feature to me, but could be useful for others.
Color support. It is common to want to switch between black/white backgrounds to support different types of monitors, lighting environments, and printing. It makes sense to have some notion of toggling dark green turning to light green and vice versa along with the background color.
The improved X-trace feature request is definitely a known one.
As a temporary work around for others trying to figure out how to get the trend legend names to match the trends in the same order on trends with multiple subplots
unselect the alphabetize pens option as discussed previously (expert section)
modify the pen names to start with “A/” “B/” etc
i.e
A/AI-6027 Reclaim Tank pH
B/AI-6085 Outfall Monitor pH
C/…
D/…
etc
This has the effect of creating groups (one for each pen). I usually will use one group for each subplot. i.e A/ is for subplot 1, B/ for subplot 2 etc. So long as you don’t have the “Group Pens” option selected then this should work fine
Regarding the color support feature request. The control that is missing on the easy chart but present on the date range control is the “Editor Background” color attribute.
If this could be incorporated so that both the white backgrounds of the realtime and historical mode date range selection boxes were controllable then this would pretty muchly solve this issue.