First of all, my name’s Chris and I work for Michelin Tire company in Ardmore, Oklahoma. I’m new to the forum but have been working on implementing KEP,FSQL,FPMI and MySQL into our Data Acquisition system.
First things first, the machines we use make or mix rubber for the plant. A single “Batch” of rubber takes anywhere from 1 1/2 min to 3 1/2 min to mix. During that time, we have a “BATCH START” trigger in the PLC5. Once triggered, we capture that moments data and also start capturing 5 sec. data. At the end of the batch there is a “END OF BATCH” trigger, it captures the last moment of data. By data i mean, mixer speed, KWH, Step #, Current Recipe… etc. When it is the “End of Batch” and it stores the last moment of data, a “PC Upload request” bit is made.
In FSQL under Project, I have made a new folder for Batch Data and within that folder created a “Block group”. I have all the tags that are updated every 5 sec in PLC within this group. It is triggered off of the “PC Upload request”. As you can already guess, my TIME STAMP for say ONE batch of rubber is the same for EVERY 5 sec bit of data within that batch.
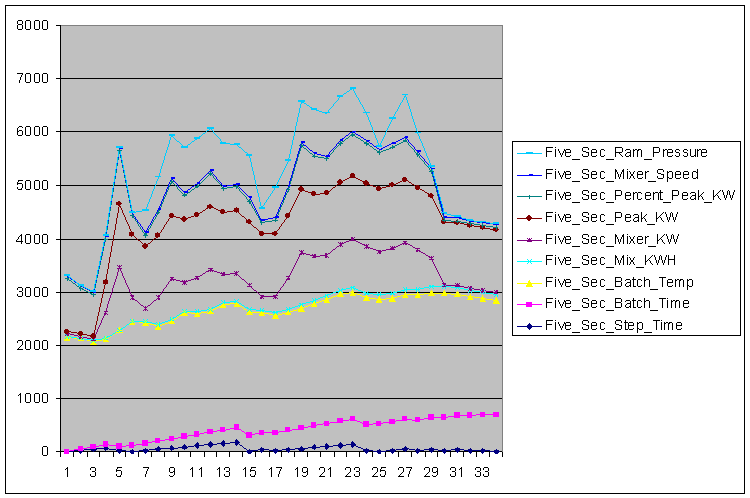
So, here is the real question, using the chart in FPMI, do i graph this data if all the t_stamps are the same? I also capture BATCH TIME, which is going to change and this gives me a better idea of WHEN the information in EACH row of the SQL database is, but if i try to use that for my x axis, it doesn’t work, i would assume because the slider at the bottom of the chart if utilized for DATETIME, not BIGINT.
Any suggestions, critisism, witty remarks and questions are welcome LOL.
Thanks in advance.
-Chris