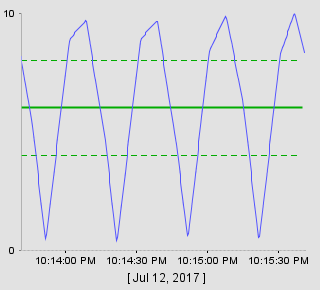
I’m creating a template that uses the easy chart component with four pens configured. One pen is the value of some process variable, one is a constant showing the target value of that process variable, the other two are constants showing the upper and lower desirable operating limits of the process variable. On the Y-axis I’d like to display only the upper and lower values along with markings for the min setpoint, max setpoint, and target values. On the X-axis I’d like to remove the date in the brackets that is inserted by default.
I’m trying to find the jfreechart parameters or methods to use in the configurChart extension fuction of the easy chart that might allow me to do this but so far haven’t found them. Is there a way to do this?