I’ve seen a weird problem I’m hoping can be explained. I’m putting two analog points in history. The history partition is set to 5 minutes, and the prune age is 15 minutes. The data pruning appears to be working since I do not see many partitions and the time stamps assigned to them are correct.
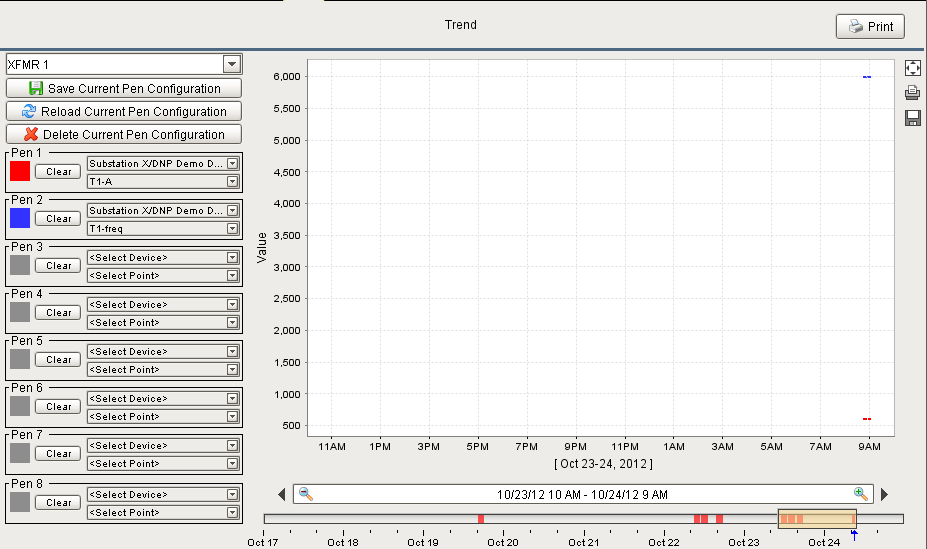
My problem is with Easy Chart. As seen in the attachment, I have ghost data that does not exist (see bar under time range with red blocks). You will also notice I have selected a time range that encompasses more than one block of data, but only one block is showing data (the latest, with a small blue line near the right-top and red line near right-bottom).
Is there some form of data cache and/or is this a bug?
It looks like the prune function is not properly clearing out the scan class execution records, which are a piece that fits into how the data histogram is calculated.
These records are stored in the “sqlth_sce” table. They cover a range, described by “start_time” and “end_time”. This knowledge base article explains how to get those times into a more readable format. At any rate, take a look at that table, and try deleting some of the older rows to see if that makes a difference. We’ll take a look at it on our side as well.