Hi,
I’m trying to display a bar for every change in a tag history value on my easy chart with its corresponding label. But at the moment it displays it as follows (The grey looking chart with black line):
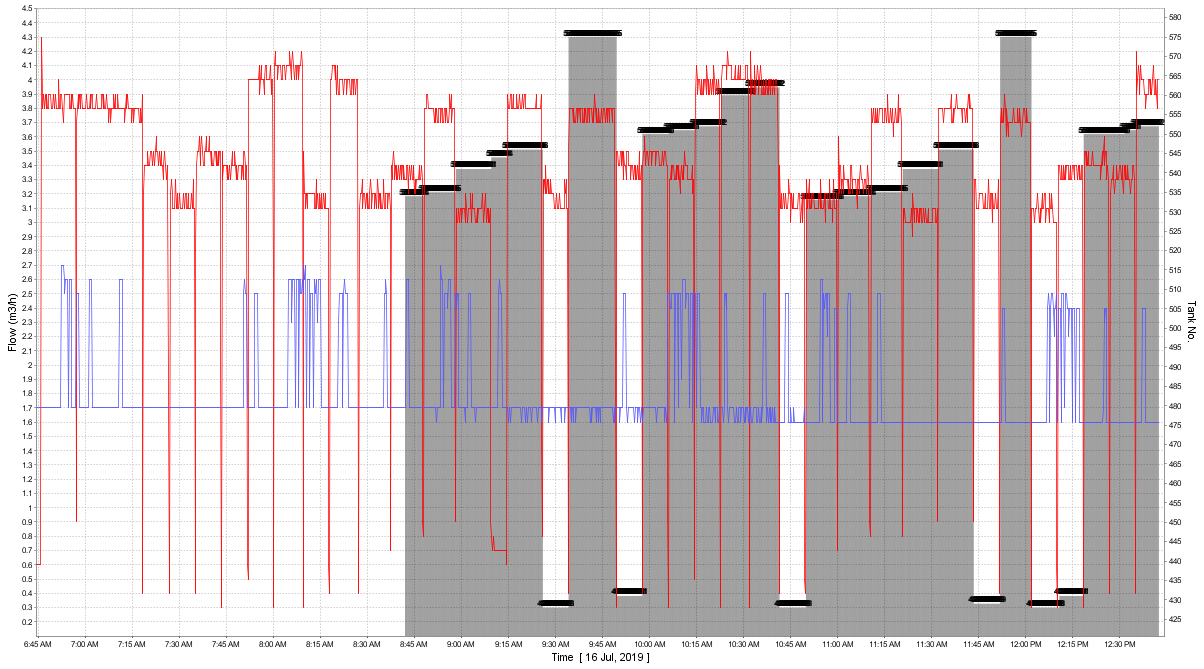
The grey pen is not an area chart but a bar chart. But due to the frequent updating, it’s making it look like that! Any idea how I can submit a value to the easy char from a tag history only on changes to the tag history so it looks like a proper bar chart? If not on changes, can I increase the period which the update occurs?
Thanks in advance and regards,
Amir