Hi,
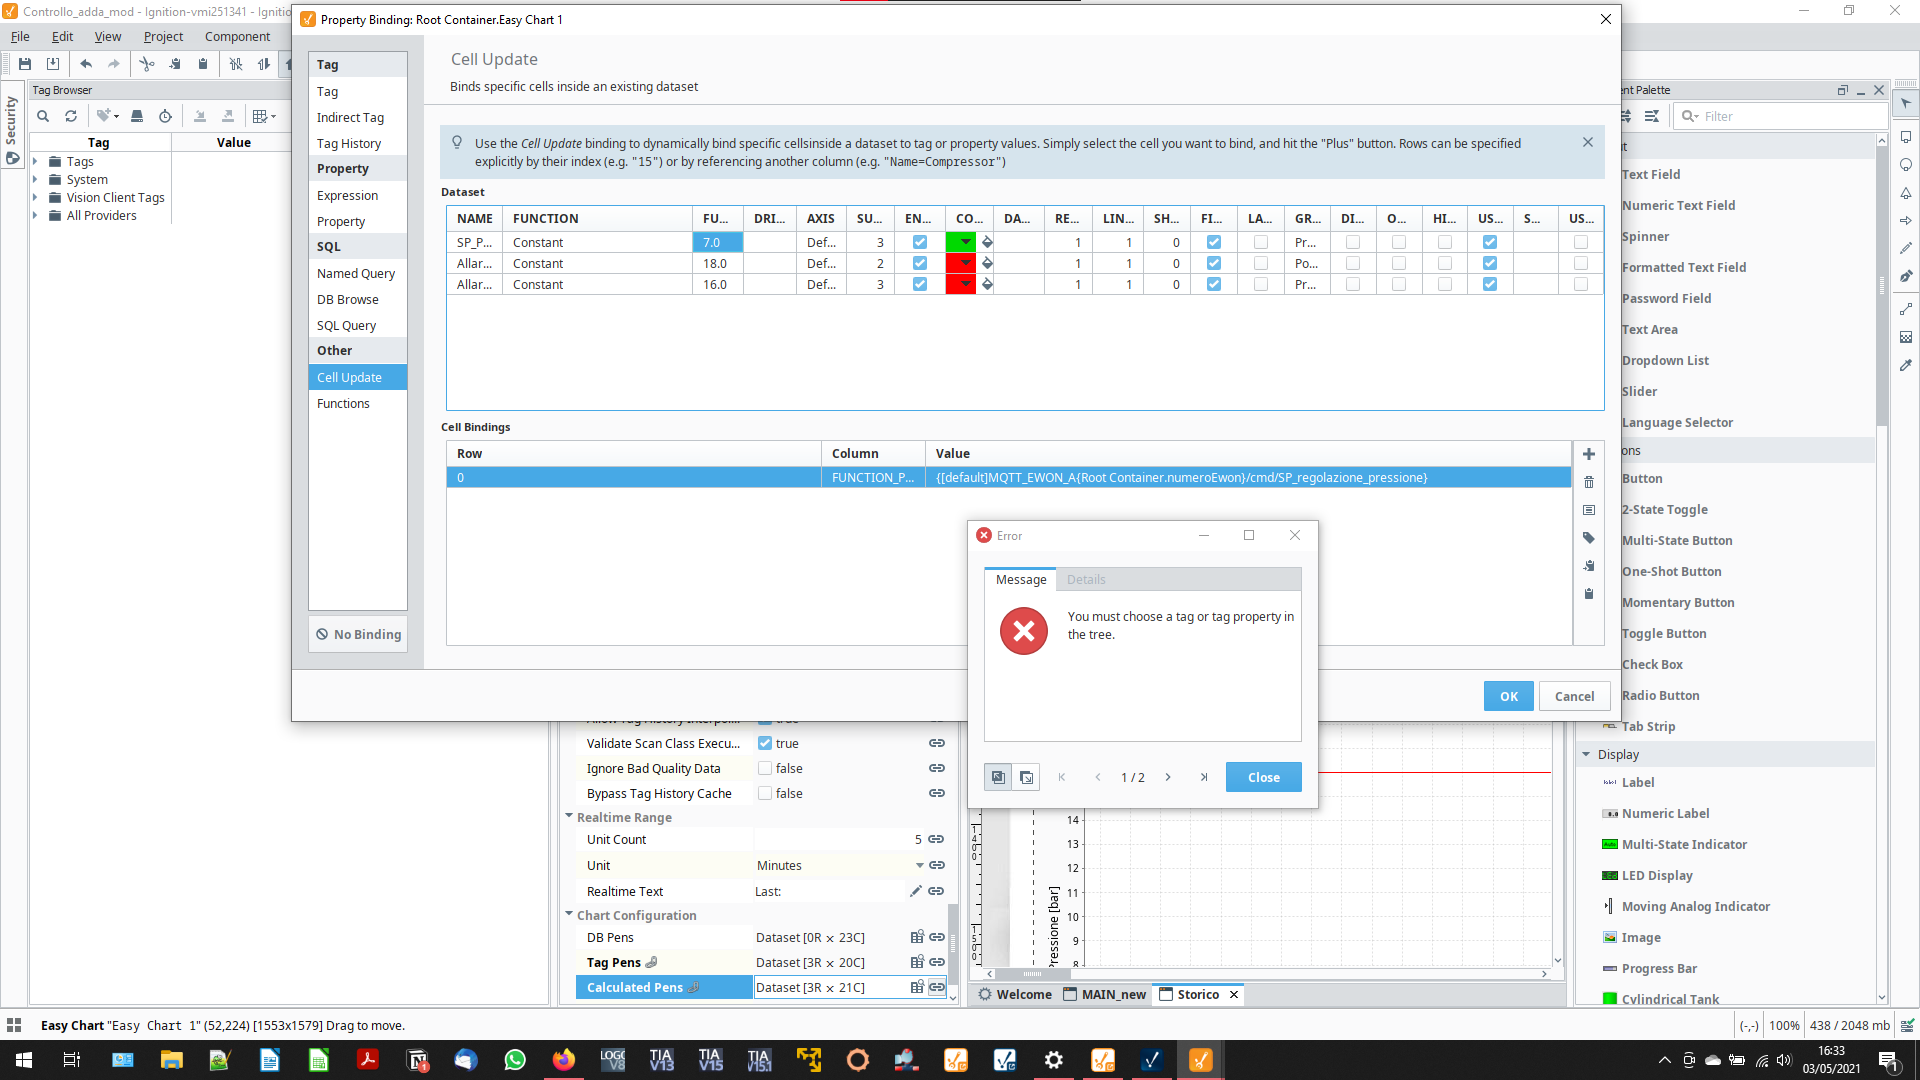
I’ve created an Easy Chart where it’s displayed the tag history of a certain value, through a Cell Update Binding I was able to dynamically change the tag history to different values set by the user with a Dropdown List. Now I would like to see in the same graph two other values related to the value ( a set point and an alarm value), those two don’t have any history set up so I created two Calculated Pens but I’m not able to create a dynamic binding with the Cell Update (I’ve included two screenshots to see the different errors I get).
Is it possible?
Thanks, regards
Daniele