Hi,
When I set True the legend.visible property of the TimeSeriesChart, each time when I open parent view, the chart randomly doesn’t render correctly.
I found out zoom in/out browser trigger it and it render OK after re zooming the browser.
I test it in Chrome and ignition v8.0.6 to v8.0.10 and see same behaviour.
@nader.chinichian, can you post a screenshot of the rendering issue that you are seeing?
Hi Joshua
The issue is that chart completely doesn’t show up. When I zoom in and take closer look it seems that the whole chart object offset from bottom to up and get out of the box area. It like I set bottom padding to component and make it get out of the box area.
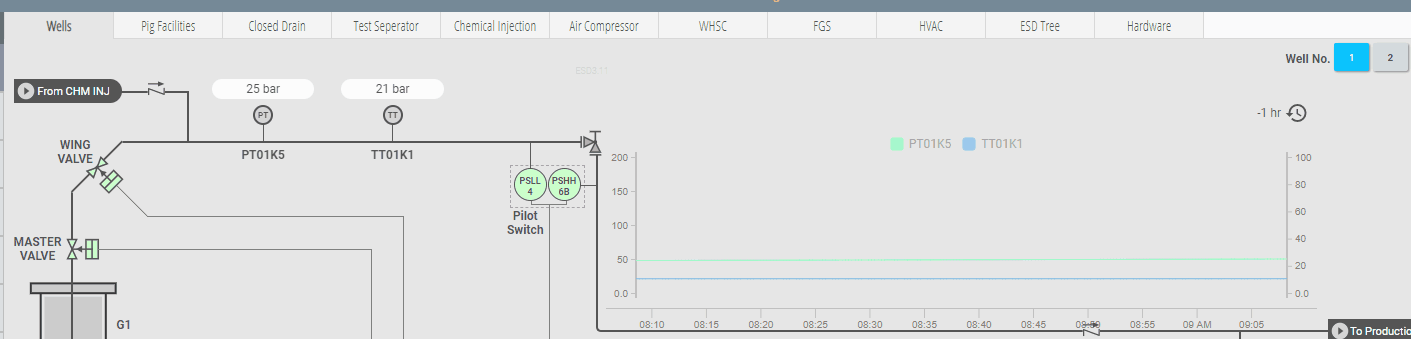
It is not seen in the gif but some times i can reproduce specially in different version from v8.0.6 to v8.0.10.
Thanks for the screenshot and description. I will try to replicate the behavior.
Hi
Did you mange to replicate the bug?
Not with any of my initial tests. I have a bug open so I can devote some time to replicating this.
Just to rule out any side effects… Do you have any scripts or other functionality that could be toggling the visibility/positioning of the chart?
No, I just embedded my views in tab consider.
I only see this bug when I visible legend.
Hi Joshua
Still I have this problem in 8.0.12 .
I find out this bug show itself in heavy loaded view.
Just zoom in and out view trigger trend to show it again.
Can you give some trick to fix it or report it as big to investigate.
Hi Nader,
I’ve got the bug logged but haven’t worked it yet. The default legend used by the underlying chart library seems to be a bit buggy; I’ve got got another bug logged about initial rendering issues with it. Unfortunately, we didn’t see any of these display issues when we exposed the legend. It may be best to keep the legend hidden until I can get a fix out for this so your chart data is still visible. This is high on my todo list.
Thanks.
If you create view with a lot of heavy objects you can defenately see this bug.
By the way when we can use your new easy chart? 
Sounds good; I can try to replicate in that way. The Easy Chart / Power Chart is moving along well! I’m nearing the end of development, and we’ll start testing soon. No release date yet.