I have a report that is configured in a script. The report is generated to a PDF via the system.report.executeAndDistribute() function. This report works in Reports Preview in the Designer:
I’ve checked everywhere in this forum, and elsewhere online, but I can’t seem to figure out why this happens. I expect it is the difference between the actual report and creating it using executeAndDistribute(). I hope someone here can help.
Below is the script that generates the PDF report:
Sometimes your post isn't seen, sometimes nobody knows, sometimes nobody has time. The forum is not an official support venue, everybody here is a volunteer, and 99%+ are users and not IA employees.
Give support a call if it's urgent or when your post doesn't get an answer.
I saw your post. I didn't have a clue. It happens.
Consider adding a script inside the report that simply logs the parameters that were supplied. Then you can spot any difference between the two execution methods. (The report viewer still executes the report in the gateway.)
I don’t know this will fix your issue, but this stands out to me - prefix with r or use \\ in your path since \ is Python’s escape character.
path = r"C:\KilnReports\K" + str(kilnNum)
or
path = "C:\\KilnReports\\K" + str(kilnNum)
Also, what version are you working with? Can you share more about the report design? What chart type and any scripts attached to it that may be extending the date range? Is this sporadic or every attempt? Do you have any other reports that don’t do this?
I find the more you give out the more you get back.
I don’t know this will fix your issue, but this stands out to me - prefix with r or use \\ in your path since \ is Python’s escape character.
path = r"C:\KilnReports\K" + str(kilnNum)
or
path = "C:\\KilnReports\\K" + str(kilnNum)
Neither of these suggestions worked.
I am using v8.1.41.
The report uses a Timeseries Chart with 4 tag_history pens to show historical tags. The chart renders just fine when in the Report Preview in Designer. There are no scripts in the report - just the script that calls the executeAndDistribute function in the actionPerformed event handler configured on a Button that is on a Vision Window. This window also shows the graph on an EasyChart on the same window which also renders just fine. This is the only report in the entire project so far so I have nothing to compare.
The only parameters that are used in the report are the StartDate and EndDate and they are displayed in text at the top of the report and are always correct.
Do you have a different timezone between your Designer and the gateway? The data going to almost exactly 1 hour later would maybe point me to consider that.
Also you have StartDate and then startDate, could the case difference between those be an issue with displaying one in the text at the top but using the other in the parameters.
I really don't know but those two thoughts came to mind to try and help.
Thanks for the questions. I hope this helps clarify how I am producing this report. As you can see below, all values displayed on the report are parameters. The parameters are used to display the values at the top, and the StartDate and EndDate are used for the Historical Date Range.
This is the configuration of the data for the report in Designer:
I know it is not specific to the “executeAndDistribute” script function because I added a “Report Viewer” to a popup window and the report still doesn’t handle the date range properly, and looks just like the PDF that is generated by the script function. This indicates to me that there is an issue with the report, but it displays fine in Preview mode in Designer.
Hmm, nothing is striking me as incorrect. Have you enabled any the Advanced options on the Tag Historian Query?
If you willing to DM me an export of the Report and the Vision window I’m happy to take a look at them.
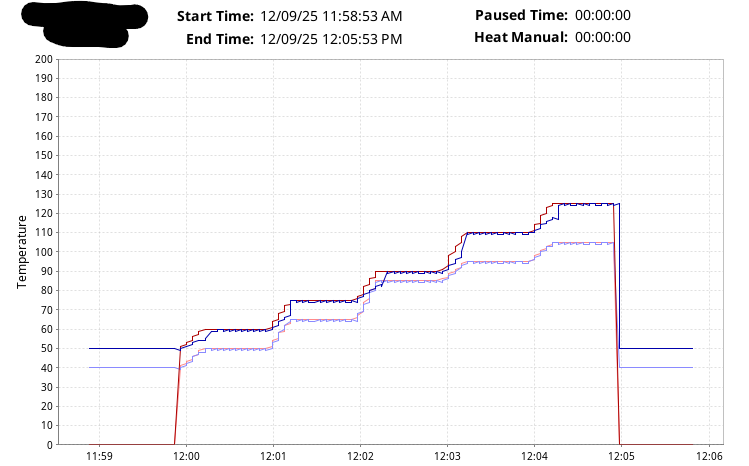
Charts displayed in Preview have a different PDI than the chart in the output PDFs. This accounts for the differences. As an example, the charts below is the exact same chart with the same data, but different DPI. Note the different increments.