I am not able to adjust the number of ticks on my y axes like I can on the timeAxis. There are 11 ticks and there is not a way to change it.
I will open a feature request.
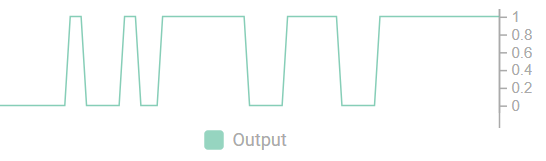
I’d also like to request this feature. 5 ticks on a Boolean plot doesn’t make sense.
@braydon.hancock, a better display for boolean data is definitely a good idea. I recall a feature request being opened for this, but if not I will open one.