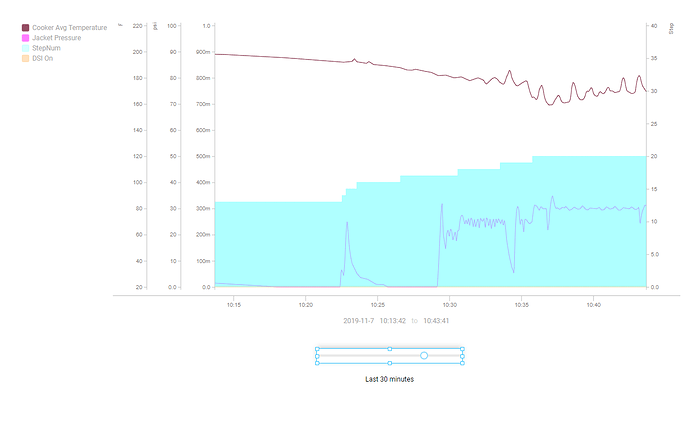
On this page, I have a slider the output of which is bound to 4 realtime tag historian queries (to build the chart) and a text expression (to show the time span). Dragging the slider is very laggy. Any suggestions?
The slider component appears to be laggy because your queries are being rerun constantly as the slider value actively changes when dragged. I’ve created a feature ticket to add a Defer Updates mode option on the component so that the value will only update once it’s not actively changing. In the meantime, I would suggest using a different component like numeric entry field to output a single fixed value for the desired time span.
Thank you.
You have pen names (legend) in the chart. Can you select/deselect pens with this chart similar way as in XY Chart?
Based on my knowledge, this chart type does not support selectable pens, or does it?
Thank you in advance,
Janne
I use similar method but I minimize the tick step to 1 hours step for last 24 hours. If you decrease the step it will help a lot.
you can use a button next to slider to put the slider final value to history query
I wish it had a select/deselect feature. I added check boxes to the left that turn the trends on/off. This works as long as you only have one pen per axis. For other pens that you want to use the same axis, create a new axis with the same scale and just make it invisible by setting the width to -1. Not the best solution but it works for now.
I did similar by setting my steps to 5 minutes. A deferred action will be much better. I might build a script into the slider to create the deferred affect.
Deferring it was too easy. Add the following to an onClick event. Not sure how that work with a mobile device.
self.custom.defValue = self.props.value
