Ignition Version: 8.1.31
Host: Debian 12 - Proxmox VM (8 Cores (E5-2650 v2), 4GB Ram, 2GB Allocated to Ignition)
G1GC
I am having an issue (at least i assume this is an issue) where the GC is collecting ~1GB every 15 seconds. I am not sure what brought this on or how long it has been going on (need to keep better tabs on resources). I have tried closing all perspective sessions and vision clients with no change. I have went through and disabled any timer scripts which also did not make a noticeable difference. Aside from tag change scripts, what else do i need to be looking at to try and determine the source of this issue? Also, are there any tools (built in or external) that might help pinpoint the source of this? I see no relevant wrapper log entries. CPU utilization ~5%.
This is probably pretty typical. I don't keep too close of tabs on my gateways as long as garbage collection is working. It's normal to have a sawtooth pattern, and in fact, probably an issue if you don't see it as that would mean garbage collection isn't working. Are you having any performance issues?
I assumed that if the frequency of collections is faster than the memory trend data in the gateway web interface polls (producing a trend that does not accurately represent what is occurring) than this must be excessive? I have noticed for some time that saving a project in designer, among other things, is not near as fast as it used to be. I am also getting clock drift warnings.
Clock drifts can happen easily on virtual machines. In VMware ESXi, you can reserve resources for exclusive use by the VM, and for Ignition it is recommended to do so. I've tried finding similar settings for ProxMox, but I haven't found anything definitive/easy (I found guys trying to do something like this in some forums, but it was very involved). I have noticed in ProxMox when testing that I get more clock drifts than I do with ESXi, and I'm guessing this is the cause.
Fair point. This runs in a Proxmox cluster, and in “normal” circumstances it is the only VM running on that node to try and reduce this as much as possible.
You could try editing the CPU Units on the VM to increase it (it's relative to other VMs, so may help if it is ever running on a shared host). And make sure your CPU limit is unlimited.
That's not a lot of headroom. If you're doing much on this gateway, you might just need more.
With some GC tuning flags you may be able to trade CPU for less memory pressure (by telling the GC to run more aggressively) but I personally wouldn't even try; I'd just double the server and Ignition memory and call it a day.
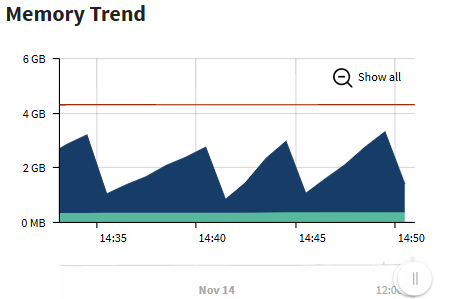
I now have 8GB allocated to the VM and 4GB to ignition. Something I'm seeing now that has me confused is the lack of correlation between the memory gauge(?) and the memory trend.
Data from jstat:
**
From Gateway Web Interface:**
As you can see, between 14:40:00 and 14:43:30 (from jstat data), there are 5 collections, whereas in the memory trend in gateway web interface, I'm only seeing one collection occuring within that timeframe. Are these not the same metric?