Short version
Is there an issue with the audit log causing some kind of cpu usage loop?
Is PropertiesFactory loading a properties files from jar files on the gateway something my company added or something native to Ignition?
What is that?
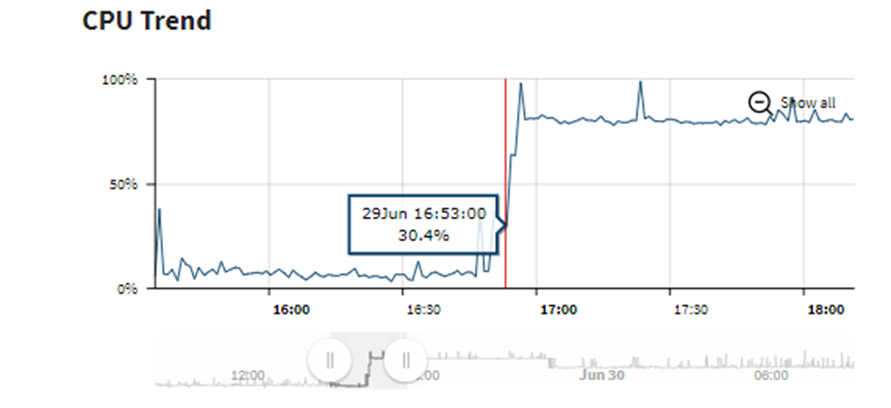
My CPU utilization cranked up to 80% for hours and hasn't gone below 50% since.
I will probably restart soon, but I want to do some investigating first.
I am using Ignition 8.1.19
I was trying to look at audit logs on the gateway.
I did a search for a target using %machineName% for example over the last 6 months.
The gateway started to hang.

I thought hanging would be the end of it.
However, instead the CPU utilization went to 80%, stayed there for hours, and still has not gone back down since.
The timestamps seem to line up with the first audit search hanging.
29Jun2023 16:53:22 is when I had the first issue with the audit.
From the diagnostics log, I had these repeating issues from that one audit that hung.

The other event that happened just before were an internal database
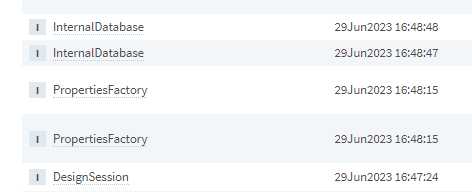
The propertiesfactory items happened at the same time, a double loading of the same properties files.
Then the InternalDatabase items were a double creation of auto-backup of internal database config.idb.
It is kind of hard to tell which of these events are the causal one for the CPU going high, and then I don't know why it has remained high ever since, ranging from 50-90,instead of hovering around 10%.
I suspect that the double call of loading properties files from jar files in the gateway from a wicket extension something apache might be the issue.
Looking at the timestamps and the curve, it seems like it might be the audit search caused a looping issue that has not gone away, but I think that is definitely native to Ignition.
I thought the other thing happened 2 times simultaneously which seems like a bug somewhere.