Hiding the heatmap bar at xy chart

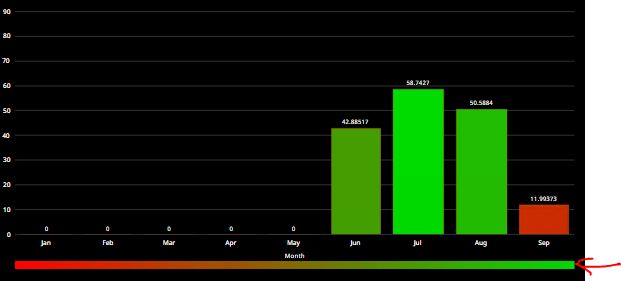
How do I hide the heat map gradient bar?
How can I implement Custom range for the bar colors

0 - 30 = red
31 - 60 = orange
61-100 = green

help 1
help 2

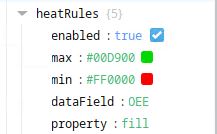
Don't use the heatmap option
Add a key holding color value in your dataSources. Assign that key to Series[x].column.appearance.deriveFieldsFromData.fill.color

Following is small example for reference.

XY Chart Colored Columns
[
  {
    "type": "ia.chart.xy",
    "version": 0,
    "props": {
      "xAxes": [
        {
          "name": "time",
          "label": {
            "enabled": true,
            "text": "Time",
            "color": ""
          },
          "visible": true,
          "tooltip": {
            "enabled": true,
            "text": "",
            "cornerRadius": 3,
            "pointerLength": 4,
            "background": {
              "color": "",
              "opacity": 1
            }
          },
          "inversed": false,
          "render": "date",
          "category": {
            "break": {
              "enabled": false,
              "startCategory": "",
              "endCategory": "",
              "size": 0.05
            }
          },
          "date": {
            "baseInterval": {
              "enabled": false,
              "timeUnit": "hour",
              "count": 1,
              "skipEmptyPeriods": false
            },
            "range": {
              "max": "",
              "min": "",
              "useStrict": false
            },
            "break": {
              "enabled": false,
              "startDate": "",
              "endDate": "",
              "size": 0.05
            },
            "inputFormat": "yyyy-MM-dd kk:mm:ss",
            "format": "M/d"
          },
          "value": {
            "range": {
              "max": "",
              "min": "",
              "useStrict": false
            },
            "logarithmic": false,
            "break": {
              "enabled": false,
              "startValue": 0,
              "endValue": 100,
              "size": 0.05
            },
            "format": "#,###.##"
          },
          "appearance": {
            "opposite": false,
            "inside": false,
            "labels": {
              "color": "",
              "opacity": 1,
              "rotation": 0,
              "verticalCenter": "middle",
              "horizontalCenter": "middle"
            },
            "grid": {
              "color": "",
              "opacity": 1,
              "dashArray": "",
              "minDistance": 60,
              "position": 0.5
            },
            "font": {
              "size": "",
              "weight": 500
            }
          }
        }
      ],
      "yAxes": [
        {
          "name": "process temp",
          "label": {
            "enabled": true,
            "text": "Process Temp",
            "color": ""
          },
          "visible": true,
          "tooltip": {
            "enabled": true,
            "text": "",
            "cornerRadius": 3,
            "pointerLength": 4,
            "background": {
              "color": "",
              "opacity": 1
            }
          },
          "inversed": false,
          "render": "value",
          "category": {
            "break": {
              "enabled": false,
              "startCategory": "",
              "endCategory": "",
              "size": 0.05
            }
          },
          "date": {
            "baseInterval": {
              "enabled": false,
              "timeUnit": "hour",
              "count": 1,
              "skipEmptyPeriods": false
            },
            "range": {
              "max": "",
              "min": "",
              "useStrict": false
            },
            "break": {
              "enabled": false,
              "startDate": "",
              "endDate": "",
              "size": 0.05
            },
            "inputFormat": "yyyy-MM-dd kk:mm:ss",
            "format": "M/d/yyyy HH:mm:ss"
          },
          "value": {
            "range": {
              "max": "",
              "min": "",
              "useStrict": false
            },
            "logarithmic": false,
            "break": {
              "enabled": false,
              "startValue": 0,
              "endValue": 100,
              "size": 0.05
            },
            "format": "#,###.##"
          },
          "appearance": {
            "opposite": false,
            "inside": false,
            "labels": {
              "color": "",
              "opacity": 1,
              "rotation": 0,
              "verticalCenter": "middle",
              "horizontalCenter": "middle"
            },
            "grid": {
              "color": "",
              "opacity": 1,
              "dashArray": "",
              "minDistance": null,
              "position": 0.5
            },
            "font": {
              "size": "",
              "weight": 500
            }
          }
        },
        {
          "name": "output temp",
          "label": {
            "enabled": true,
            "text": "Output Temp",
            "color": ""
          },
          "visible": true,
          "inversed": false,
          "tooltip": {
            "enabled": true,
            "text": "",
            "cornerRadius": 3,
            "pointerLength": 4,
            "background": {
              "color": "",
              "opacity": 1
            }
          },
          "render": "value",
          "category": {
            "break": {
              "enabled": false,
              "startCategory": "",
              "endCategory": "",
              "size": 0.05
            }
          },
          "date": {
            "baseInterval": {
              "enabled": false,
              "timeUnit": "hour",
              "count": 1,
              "skipEmptyPeriods": false
            },
            "range": {
              "max": "",
              "min": "",
              "useStrict": false
            },
            "break": {
              "enabled": false,
              "startDate": "",
              "endDate": "",
              "size": 0.05
            },
            "inputFormat": "yyyy-MM-dd kk:mm:ss",
            "format": "M/d/yyyy"
          },
          "value": {
            "range": {
              "min": "",
              "max": "",
              "useStrict": false
            },
            "logarithmic": false,
            "break": {
              "enabled": false,
              "startValue": 0,
              "endValue": 100,
              "size": 0.05
            },
            "format": "#,###.##"
          },
          "appearance": {
            "opposite": true,
            "inside": false,
            "labels": {
              "color": "",
              "opacity": 1,
              "rotation": 0,
              "verticalCenter": "middle",
              "horizontalCenter": "middle"
            },
            "grid": {
              "color": "",
              "opacity": 1,
              "dashArray": "4,4",
              "minDistance": null,
              "position": 0.5
            },
            "font": {
              "size": "",
              "weight": 500
            }
          }
        }
      ],
      "series": [
        {
          "name": "process temp",
          "label": {
            "text": "Process Temp"
          },
          "visible": true,
          "hiddenInLegend": false,
          "defaultState": {
            "visible": true
          },
          "data": {
            "source": "example",
            "x": "t_stamp",
            "y": "process_temp"
          },
          "xAxis": "time",
          "yAxis": "process temp",
          "zIndex": 0,
          "tooltip": {
            "enabled": true,
            "text": "{name}: [bold]{valueY}[/]",
            "cornerRadius": 3,
            "pointerLength": 4,
            "background": {
              "color": "",
              "opacity": 1
            }
          },
          "render": "column",
          "candlestick": {
            "open": {
              "x": "",
              "y": ""
            },
            "high": {
              "x": "",
              "y": ""
            },
            "low": {
              "x": "",
              "y": ""
            },
            "appearance": {
              "fill": {
                "color": "",
                "opacity": 1
              },
              "stroke": {
                "color": "",
                "opacity": 1,
                "width": 1
              },
              "stacked": false,
              "deriveFieldsFromData": {
                "fill": {
                  "color": "",
                  "opacity": ""
                },
                "stroke": {
                  "color": "",
                  "opacity": "",
                  "width": ""
                }
              },
              "heatRules": {
                "enabled": false,
                "max": "",
                "min": "",
                "dataField": ""
              }
            }
          },
          "column": {
            "open": {
              "x": "",
              "y": ""
            },
            "appearance": {
              "fill": {
                "color": "",
                "opacity": 1
              },
              "stroke": {
                "color": "",
                "opacity": 1,
                "width": 1
              },
              "stacked": false,
              "width": null,
              "height": null,
              "deriveFieldsFromData": {
                "fill": {
                  "color": "color",
                  "opacity": ""
                },
                "stroke": {
                  "color": "",
                  "opacity": "",
                  "width": ""
                }
              },
              "heatRules": {
                "enabled": false,
                "max": "",
                "min": "",
                "dataField": ""
              }
            }
          },
          "line": {
            "open": {
              "x": "",
              "y": ""
            },
            "appearance": {
              "connect": true,
              "tensionX": 1,
              "tensionY": 1,
              "minDistance": 0.5,
              "stroke": {
                "width": 3,
                "opacity": 1,
                "color": "",
                "dashArray": ""
              },
              "fill": {
                "opacity": 0,
                "color": ""
              },
              "bullets": [
                {
                  "enabled": false,
                  "render": "circle",
                  "width": 10,
                  "height": 10,
                  "label": {
                    "text": "{value}",
                    "position": {
                      "dx": 0,
                      "dy": 0
                    }
                  },
                  "fill": {
                    "color": "",
                    "opacity": 1
                  },
                  "stroke": {
                    "color": "",
                    "opacity": 1,
                    "width": 1
                  },
                  "rotation": 0,
                  "tooltip": {
                    "enabled": true,
                    "text": "{name}: [bold]{valueY}[/]",
                    "cornerRadius": 3,
                    "pointerLength": 4,
                    "background": {
                      "color": "",
                      "opacity": 1
                    }
                  },
                  "deriveFieldsFromData": {
                    "fill": {
                      "color": "",
                      "opacity": ""
                    },
                    "stroke": {
                      "color": "",
                      "opacity": "",
                      "width": ""
                    },
                    "rotation": ""
                  },
                  "heatRules": {
                    "enabled": false,
                    "max": 100,
                    "min": 2,
                    "dataField": ""
                  }
                }
              ]
            }
          },
          "stepLine": {
            "open": {
              "x": "",
              "y": ""
            },
            "appearance": {
              "connect": true,
              "tensionX": 1,
              "tensionY": 1,
              "minDistance": 0.5,
              "stroke": {
                "width": 3,
                "opacity": 1,
                "color": "",
                "dashArray": ""
              },
              "fill": {
                "opacity": 0,
                "color": ""
              },
              "bullets": [
                {
                  "enabled": true,
                  "render": "circle",
                  "width": 10,
                  "height": 10,
                  "label": {
                    "text": "{value}",
                    "position": {
                      "dx": 0,
                      "dy": 0
                    }
                  },
                  "fill": {
                    "color": "",
                    "opacity": 1
                  },
                  "stroke": {
                    "color": "",
                    "opacity": 1,
                    "width": 1
                  },
                  "rotation": 0,
                  "tooltip": {
                    "enabled": true,
                    "text": "{name}: [bold]{valueY}[/]",
                    "cornerRadius": 3,
                    "pointerLength": 4,
                    "background": {
                      "color": "",
                      "opacity": 1
                    }
                  },
                  "deriveFieldsFromData": {
                    "fill": {
                      "color": "",
                      "opacity": ""
                    },
                    "stroke": {
                      "color": "",
                      "opacity": "",
                      "width": ""
                    },
                    "rotation": ""
                  },
                  "heatRules": {
                    "enabled": false,
                    "max": 100,
                    "min": 2,
                    "dataField": ""
                  }
                }
              ]
            }
          }
        }
      ],
      "dataSources": {
        "example": [
          {
            "t_stamp": "Tue Aug 07 2018",
            "process_temp": 63,
            "output_temp": 38,
            "color": "red"
          },
          {
            "t_stamp": "Tue Aug 08 2018",
            "process_temp": 59,
            "output_temp": 39,
            "color": "blue"
          },
          {
            "t_stamp": "Tue Aug 09 2018",
            "process_temp": 62,
            "output_temp": 41,
            "color": "yellow"
          }
        ]
      }
    },
    "meta": {
      "name": "XYChart"
    },
    "position": {
      "x": 0.3949,
      "y": 0.0981,
      "width": 0.2458,
      "height": 0.4839
    },
    "custom": {}
  }
]