Hi!
I have a XYChart configured this way:

As you can see is a column series with 2 groups. Here is the JSON:
XYChart JSON
[
{
"type": "ia.chart.xy",
"version": 0,
"props": {
"xAxes": [
{
"name": "time",
"label": {
"enabled": false,
"text": "Time",
"color": ""
},
"visible": true,
"tooltip": {
"enabled": true,
"text": "",
"cornerRadius": 3,
"pointerLength": 4,
"background": {
"color": "",
"opacity": 1
}
},
"inversed": false,
"render": "date",
"category": {
"break": {
"enabled": false,
"startCategory": "",
"endCategory": "",
"size": 0.05
}
},
"date": {
"baseInterval": {
"enabled": true,
"timeUnit": "minute",
"count": 1,
"skipEmptyPeriods": false
},
"range": {
"max": "",
"min": "",
"useStrict": false
},
"break": {
"enabled": false,
"startDate": "",
"endDate": "",
"size": 0.05
},
"inputFormat": "yyyy-MM-dd hh:mm:ss",
"format": "MM/dd h a"
},
"value": {
"range": {
"max": "",
"min": "",
"useStrict": false
},
"logarithmic": false,
"break": {
"enabled": false,
"startValue": 0,
"endValue": 100,
"size": 0.05
},
"format": "#,###.##"
},
"appearance": {
"opposite": true,
"inside": false,
"labels": {
"color": "",
"opacity": 1,
"rotation": 0,
"verticalCenter": "middle",
"horizontalCenter": "middle"
},
"grid": {
"color": "",
"opacity": 0.4,
"dashArray": "",
"minDistance": 60,
"position": 0
},
"font": {
"size": "12px",
"weight": 500
}
},
"renderer": {
"labels": {
"template": {
"maxWidth": 70,
"wrap": true
}
}
}
}
],
"yAxes": [
{
"name": "state",
"label": {
"enabled": false,
"text": "Process Temp",
"color": ""
},
"visible": true,
"tooltip": {
"enabled": true,
"text": "",
"cornerRadius": 3,
"pointerLength": 4,
"background": {
"color": "",
"opacity": 1
}
},
"inversed": true,
"render": "category",
"category": {
"break": {
"enabled": false,
"startCategory": "",
"endCategory": "",
"size": 0.05
}
},
"date": {
"baseInterval": {
"enabled": false,
"timeUnit": "hour",
"count": 1,
"skipEmptyPeriods": false
},
"range": {
"max": "",
"min": "",
"useStrict": false
},
"break": {
"enabled": false,
"startDate": "",
"endDate": "",
"size": 0.05
},
"inputFormat": "yyyy-MM-dd kk:mm:ss",
"format": "M/d/yyyy HH:mm:ss"
},
"value": {
"range": {
"max": "",
"min": "",
"useStrict": false
},
"logarithmic": false,
"break": {
"enabled": false,
"startValue": 0,
"endValue": 100,
"size": 0.05
},
"format": "#,###.##"
},
"appearance": {
"opposite": false,
"inside": false,
"labels": {
"color": "",
"opacity": 1,
"rotation": 0,
"verticalCenter": "middle",
"horizontalCenter": "middle"
},
"grid": {
"color": "",
"opacity": 0,
"dashArray": "",
"minDistance": null,
"position": 0.5
},
"font": {
"size": "",
"weight": 500
}
}
}
],
"series": [
{
"name": "timeline",
"label": {
"text": ""
},
"visible": true,
"hiddenInLegend": true,
"defaultState": {
"visible": true
},
"data": {
"source": "data",
"x": "start",
"y": "name"
},
"xAxis": "time",
"yAxis": "state",
"zIndex": 0,
"tooltip": {
"enabled": true,
"text": "{tooltip}",
"cornerRadius": 3,
"pointerLength": 4,
"background": {
"color": "",
"opacity": 1
}
},
"render": "column",
"candlestick": {
"open": {
"x": "",
"y": ""
},
"high": {
"x": "",
"y": ""
},
"low": {
"x": "",
"y": ""
},
"appearance": {
"fill": {
"color": "",
"opacity": 1
},
"stroke": {
"color": "",
"opacity": 1,
"width": 1
},
"stacked": false,
"deriveFieldsFromData": {
"fill": {
"color": "",
"opacity": ""
},
"stroke": {
"color": "",
"opacity": "",
"width": ""
}
},
"heatRules": {
"enabled": false,
"max": "",
"min": "",
"dataField": ""
}
}
},
"column": {
"open": {
"x": "end",
"y": ""
},
"appearance": {
"fill": {
"color": "",
"opacity": 1
},
"stroke": {
"color": "",
"opacity": 0,
"width": 0
},
"width": null,
"height": 70,
"stacked": false,
"deriveFieldsFromData": {
"fill": {
"color": "color",
"opacity": ""
},
"stroke": {
"color": "",
"opacity": "",
"width": ""
}
},
"heatRules": {
"enabled": false,
"max": "",
"min": "",
"dataField": ""
}
}
},
"line": {
"open": {
"x": "",
"y": ""
},
"appearance": {
"connect": true,
"tensionX": 1,
"tensionY": 1,
"minDistance": 0.5,
"stroke": {
"width": 3,
"opacity": 1,
"color": "",
"dashArray": ""
},
"fill": {
"color": "",
"opacity": 0
},
"bullets": [
{
"enabled": false,
"render": "circle",
"width": 10,
"height": 10,
"label": {
"text": "{value}",
"position": {
"dx": 0,
"dy": 0
}
},
"tooltip": {
"enabled": true,
"text": "{name}: [bold]{valueY}[/]",
"cornerRadius": 3,
"pointerLength": 4,
"background": {
"color": "",
"opacity": 1
}
},
"fill": {
"color": "",
"opacity": 1
},
"stroke": {
"color": "",
"width": 1,
"opacity": 1
},
"rotation": 0,
"deriveFieldsFromData": {
"fill": {
"color": "",
"opacity": ""
},
"stroke": {
"color": "",
"opacity": "",
"width": ""
},
"rotation": ""
},
"heatRules": {
"enabled": false,
"max": 100,
"min": 2,
"dataField": ""
}
}
]
}
},
"stepLine": {
"open": {
"x": "",
"y": ""
},
"appearance": {
"connect": true,
"tensionX": 1,
"tensionY": 1,
"minDistance": 0.5,
"stroke": {
"width": 3,
"opacity": 1,
"color": "",
"dashArray": ""
},
"fill": {
"color": "",
"opacity": 0
},
"bullets": [
{
"enabled": true,
"render": "circle",
"width": 10,
"height": 10,
"label": {
"text": "{value}",
"position": {
"dx": 0,
"dy": 0
}
},
"tooltip": {
"enabled": true,
"text": "{name}: [bold]{valueY}[/]",
"cornerRadius": 3,
"pointerLength": 4,
"background": {
"color": "",
"opacity": 1
}
},
"fill": {
"color": "",
"opacity": 1
},
"stroke": {
"color": "",
"width": 1,
"opacity": 1
},
"rotation": 0,
"deriveFieldsFromData": {
"fill": {
"color": "",
"opacity": ""
},
"stroke": {
"color": "",
"opacity": "",
"width": ""
},
"rotation": ""
},
"heatRules": {
"enabled": false,
"max": 100,
"min": 2,
"dataField": ""
}
}
]
}
}
}
],
"dataSources": {}
},
"meta": {
"name": "XYChart"
},
"position": {
"shrink": 0,
"basis": "190px"
},
"custom": {},
"propConfig": {
"props.dataSources.data": {
"binding": {
"config": {
"path": "view.custom.data"
},
"type": "property"
}
}
}
}
]
However, I would like to have different tooltip depending on where I place the cursor (top or bottom row). I tried to set a tooltip format in the data itself, so later I can reference the tooltip doing {tooltip}. However, then it doesn't show correctly.


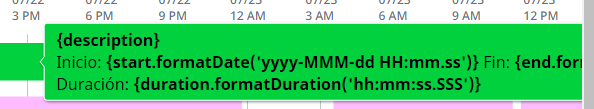
Any idea on how can I do this?
Thanks!