Overview
Introduction / Motivation
Ignition doesn’t run in a vacuum—it sits at the center of controllers, networks, databases, brokers, and other infrastructure and applications that all depend on each other. In IT operations, the way to keep that whole picture healthy is observability: a single place to see correlated traces, metrics, and logs across every layer so you can spot causes and effects quickly. At 4IR, we already monitor the rest of our ecosystem this way, but Ignition was the missing piece. The built-in diagnostics are useful, yet we needed those signals in the same observability suite as everything else. This post shares how we solved that challenge—and how you can too.
Approach
To bring Ignition into our observability stack, we focused on two key areas: metrics and logs.
-
Metrics: Prometheus is an open-source monitoring system that collects performance data (metrics) and makes it easy to graph and alert on. Using the OpenTelemetry Java Agent, we exposed Ignition’s internal metrics (like JVM health, database pool usage, Perspective sessions, and script performance) in a Prometheus-friendly format.
-
Logs: We reconfigured Ignition’s logging to output in structured JSON format. This allowed our log aggregation system to index, search, and correlate Ignition events alongside everything else—making it easy to connect the “what happened” in logs with the “why it happened” in metrics.
Once metrics and logs were available locally in standard formats, we used Grafana Alloy to scrape the Prometheus endpoint, collect the JSON logs, and forward everything to our central observability suite. With all of this data in one place, we could see what “normal” looked like, and set proactive alerts when the health of the ecosystem drifted outside those bounds.
Note: This approach exposes a vast number of metrics—some more useful than others. To stay cost-efficient and avoid noisy dashboards, we filtered out lower-value signals and focused on the ones that truly help us detect issues early.
Dashboard Screen Shots


Implementation Details / Tutorial
To get metrics out of Ignition, we first had to tap in. That meant figuring out the best way to expose what Ignition already knows about itself—JVM health, database pools, Perspective sessions, scripts, and more—so our observability stack could scrape and store it.
Metrics
We briefly considered writing a custom Ignition module, but chose not to—mainly to avoid long-term maintenance overhead. Since we run Ignition in containers and deploy with infrastructure-as-code, it made more sense to use existing, well-supported tooling like the Prometheus JMX Exporter or OpenTelemetry Java Instrumentation.
-
Prometheus JMX Exporter – Works well for JVM/runtime telemetry (Garbage Collection, memory, threads, etc.), but it only covers Java internals. To get Ignition-specific metrics, we would have had to build and maintain custom MBeans—too much ongoing work.
-
OpenTelemetry Java Instrumentation – OpenTelemetry (OTel) is an open source framework for Observability. It has a java instrumentation agent that provides both the JVM/runtime metrics and the Ignition application metrics we cared about. It integrates cleanly with collectors via OTLP, so it plugged right into the dashboards and alerts we already had.
Given the broader coverage, almost no code changes, and room to expand into traces/logs later, we decided OpenTelemetry Java Instrumentation was the clear win for us.
OpenTelemetry Integration:
Once we chose the OTel approach, the next step was integrating it with Ignition. The agent runs as a lightweight Java agent inside the container, exposing a Prometheus endpoint with all the metrics.
Step 1: Add the Java Agent
Extend your custom Ignition image to include the OTel Java agent. In your Dockerfile, download the agent and copy it into the container:
RUN apt-get update && apt-get install -y wget \\
    && wget -O opentelemetry-javaagent.jar https://github.com/open-telemetry/opentelemetry-java-instrumentation/releases/download/v2.14.0/opentelemetry-javaagent.jar

COPY opentelemetry-javaagent.jar /mnt/shared-files/lib/
Step 2: Configure Environment Variables
Enable Prometheus metrics export by setting environment variables in the Dockerfile (or in your Docker Compose / Kubernetes manifests):
ENV OTEL_TRACES_EXPORTER=none
ENV OTEL_METRICS_EXPORTER=prometheus
ENV OTEL_LOGS_EXPORTER=none
ENV OTEL_EXPORTER_PROMETHEUS_PORT=9000
ENV OTEL_EXPORTER_PROMETHEUS_HOST=0.0.0.0
ENV OTEL_EXPORTER_PROMETHEUS_PATH=/metrics
Step 3: Start Ignition with the Agent
The last step is telling Ignition’s JVM to actually start with the Java agent attached. In a docker-compose.yml, this is done by extending the command: section so it includes the -javaagent flag (and the -Dotel.* flags).
      "-javaagent:/mnt/shared-files/lib/opentelemetry-javaagent.jar",
      "-Dotel.instrumentation.dropwizard-metrics.enabled=true",
      "-Dotel.instrumentation.jdbc-datasource.enabled=true",
If you’re not running Ignition in Docker or Kubernetes, you can still attach the OpenTelemetry Java agent by updating the wrapper.conf file. Look for the wrapper.java.additional entries and add the following lines (adjust the numbers to be the next available).
wrapper.java.additional.100=-javaagent:/path/to/opentelemetry-javaagent.jar
wrapper.java.additional.101=-Dotel.instrumentation.dropwizard-metrics.enabled=true
wrapper.java.additional.102=-Dotel.instrumentation.jdbc-datasource.enabled=true
Linked below is a multi-stage Dockerfile example with the java agent and custom logging config and a docker-compose file to run ignition with the metrics enabled.
Dockerfile (1.1 KB)
docker-compose.yaml (832 Bytes)
Scraping
With the above complete, Ignition exposes a Prometheus-compatible /metrics endpoint on port 9000. From here, a collector, like Grafana Alloy, can scrape the metrics and forward them to your observability suite for dashboards and alerts.
In our case, we run on Kubernetes and already deploy Alloy via the k8s-monitoring Helm chart. To have Alloy pick up Ignition’s metrics automatically through a ServiceMonitor, we simply enabled the Prometheus Operator objects in our Helm values:
           prometheusOperatorObjects: {
             enabled: true,
          },
With this setting, Alloy creates the ServiceMonitor resources needed to discover and scrape the /metrics endpoint, then ships the data upstream.
An important configuration to take in consideration is the scrapeInterval parameter. This parameter will be the responsible to affect the total number of series for the metrics. We recommend to use 15 seconds for this parameter. It means that each minute we will have 4 data points collected. Reducing the scrape interval for lower values can lead to excessive data metrics collected and stored also can lead to possible performance impacts.
Filtering
By default, the configuration above exports all Ignition and JVM metrics. Some of these are very high-cardinality (lots of unique label values) — for example, metrics with request paths or a separate series for every Perspective session. These are great when you’re deep-diving into debugging, but they quickly become overkill (read: expensive) for day-to-day monitoring.
We found it more effective to filter down to the most useful metrics for operations. If you think other signals should be added (or dropped), please share your experience — this is definitely a place for the community to collaborate.
In Kubernetes, filtering can be handled directly in the ServiceMonitor using metricRelabelings. Rather than filtering out “noisy” metrics, we chose to be explicit about which metrics to keep.
Here's an example of service monitor with metricRelabelings to keep the useful metrics:
service-monitor-ignition.yaml (2.4 KB)
If you aren’t using Kubernetes, you can configure the filtering in your config.alloy file.
Ignition Logging
To improve our observability on Ignition, we decided to change the log output to JSON format. This will enable our monitoring systems to index and process the log information more effectively.
To achieve this, follow these steps:
-
Generate a new logback.xml.
logback.xml (2.7 KB)DBAsync is the default configuration used by Ignition for internal logs.
The JSONConsoleAppender configures the output of Ignition logs in JSON format.
Add the new logback.xml to the Ignition data directory: $IGNITION_HOME/data
To enable our logging system's parser, we configured Ignition to output only the log message. We achieved this by adding the following wrapper configurations to the Ignition start arguments:
      // logging configuration
      "wrapper.console.format=M",
      "wrapper.logfile.format=M",
      "wrapper.console.loglevel=INFO",
Ignition will output JSON logs as shown in the example below:

Alloy tails container stdout and log files, parses with JSON and regex, enriches with Kubernetes and metadata labels, filters noise, buffers and batches, sends to Grafana Cloud Logs via Loki over TLS using the tenant and API key.
Integrated Ignition Ecosystem Dashboard
With the above information gathered, we built a unified dashboard designed to bring together all the signals needed to identify issues and understand system behavior. Instead of bouncing between tools, we can see infrastructure, broker, databases, and Ignition health in one place.
Here are the sections of the dashboard and some details about each one:
Key metrics Overview:
-
CPU%, Memory%, Disk usage, Perspective sessions, DB ops/s, Uptime, SSL cert expiry.
-
Answers “is the gateway healthy right now?” with color thresholds and 1-hour sparklines.
System Overview:
-
Threads (total/running/blocked) to spot contention.
-
JVM heap vs max + G1 pools (Eden/Old/Survivor) and GC pauses for memory pressure.
-
Container I/O/CPU/RSS and network RX/TX to separate JVM issues from cgroup or node constraints.
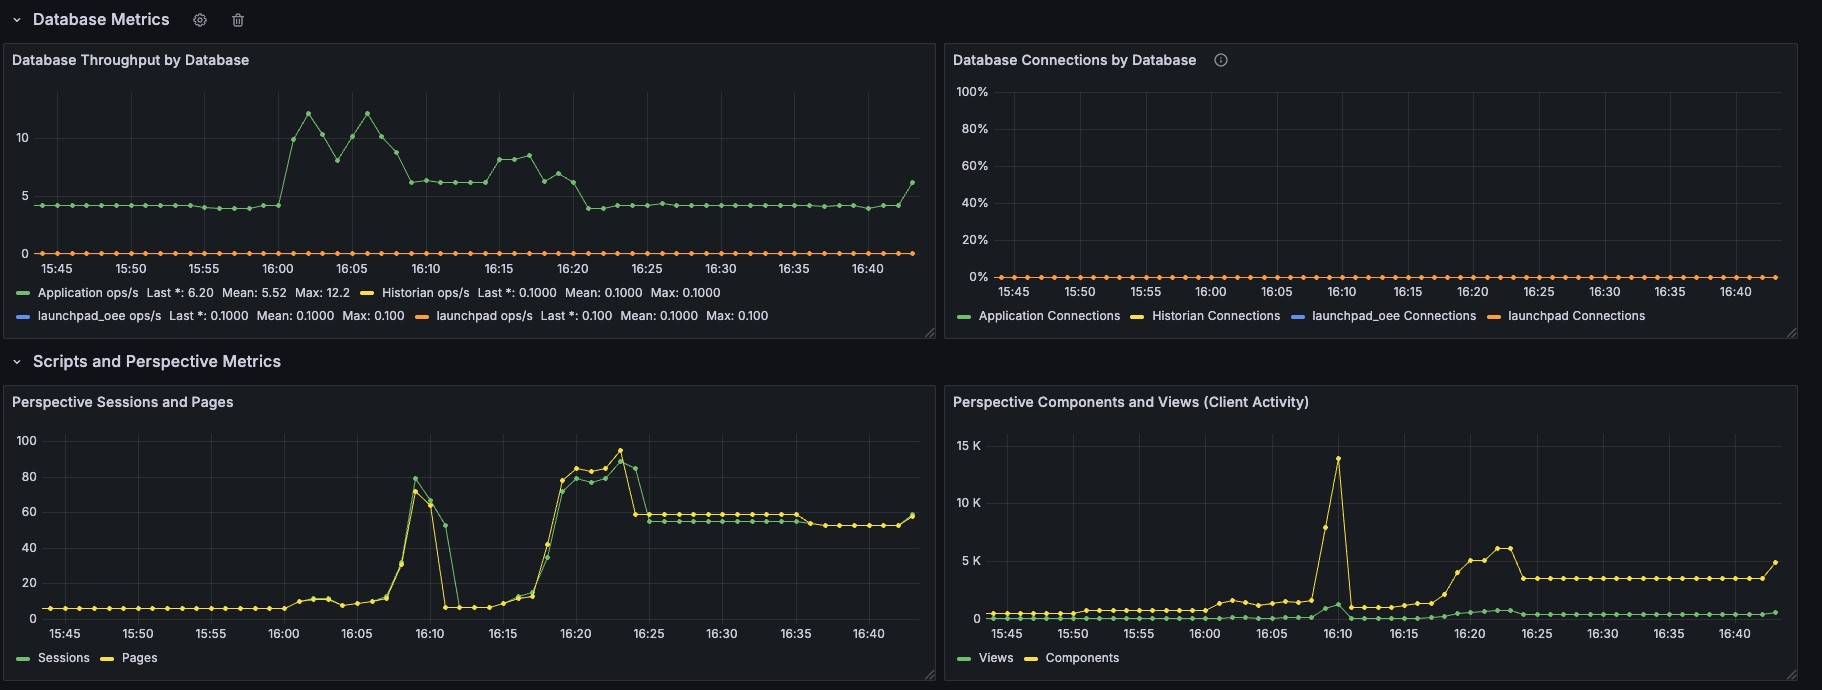
Database Metrics:
-
Throughput (ops/s) & connections per DB.
-
Optional latency/p95 if exposed; correlates with disk and network to explain slowdowns.
Perspective Metrics:
-
Sessions & pages (server load) and client views/components (front-end activity).
-
Spikes here should align with CPU and script execution.
Scripts Metrics:
-
Execution rate by script/project, Top slow projects, and p95 duration from histograms.
-
Surfaces heavy or regressing scripts without exploding cardinality.
Gateway network Metrics:
-
Message rate (incoming/outgoing) beside container network bytes/sec to detect external bottlenecks.
-
Connection churn/restarts for stability signals.
Logs:
-
JSON logs via Alloy with quick links from panels; error/warn rate and recent exceptions.
-
Used for drill-downs when a metric crosses a threshold.
RED metrics(Rate - Errors - Duration):
-
Rate: HTTP requests/sec (RPS) handled by the Gateway/Ingress.
-
Errors: 5xx error rate and ratio (5xx ÷ total). Track 4xx separately for client issues.
-
Duration: p95/p99 server request latency from request-duration histograms.
MQTT metrics:
-
Queue depth/in-flight, publish/receive rate, dropped messages, connected clients.
-
Plotted next to Gateway message rate to confirm whether issues are upstream (MQTT) or inside Ignition.
Wrapping up:
With metrics, logs, and scraping in place, Ignition becomes a first-class citizen in our observability stack. That means:
-
Unified dashboards – We can see Ignition health right alongside databases, brokers, Kubernetes, and network infrastructure. Golden signals (latency, errors, throughput, saturation) sit next to Ignition-specific metrics like Perspective sessions, database pool usage, and script performance.
-
Actionable alerts – Symptom-based alerts proactivly flag issues and link directly to dashboards.
-
Scalability – Whether you’re running a single gateway or hundreds worldwide, the same pattern applies.
-
Faster troubleshooting – The unification of telemetry makes it easy to connect “what happened” with “why” without logging into each gateway.
We’ve shared our setup and example configs to help others get started, but this is just one path. Ignition exposes a lot of signals, and every project is different.
We’d love to hear how others in the community are handling observability for Ignition.
-
Which metrics do you find most valuable?
-
What proactive alerts are most useful to catch issues before they cause downtime?
The more we share, the stronger the playbook becomes for everyone running Ignition in production.
Acknowledgments
Special thanks to The Kevin Collins, whose brilliant ideas, wise counsel, and seemingly endless depth of knowledge helped shape this project
Example Files
Here are some example files to help you get started on this approach.
- This Dockerfile builds a custom Ignition image that bundles the OpenTelemetry Java agent and logging configs, enabling Prometheus metrics export on port 9000.
Dockerfile-Ignition-Metrics (1.1 KB)
- An example, simple Docker Compose file running an Ignition gateway with OpenTelemetry agent enabled to expose metrics on port 9000.
docker-compose-custom-otel-2.yaml (832 Bytes)
- We use this file to define the format of the logs Ignition exports
logback.xml (2.7 KB)
- This is the list of metrics we find most useful.
all-metrics-list.txt (5.5 KB)
- This file configures the Kubernetes service monitor, keeping only the metrics of interest
service-monitor-ignition.yaml (2.4 KB)
- This importable JSON files defines how the dashboard in Grafana looks.
dashboard-grafana.json (107.4 KB)