Ignition Perspective - Custom Progress Bar Layout in Flex Container

I developed this chart, but I couldn’t find any built-in Perspective component that matches it.

I need to create a progress bar similar to this. I tried using a Flex Container with a Label component inside a Flex Repeater in the main view, but it didn’t render correctly in the client. I adjusted it in the view designer (tab mode), but it still didn’t scale properly with the view size.

I’m stuck on this issue. Has anyone implemented something similar? Please share your ideas or suggestions.

  • Create a flex repeater.

  • Add two custom properties, val1and val2 (the first two values on the chart).

  • Add three labels, label_0, etc.
    Bind the text properties to each:
    parent.custom.val1 (property binding)
    parent.custom.val2 (property binding)
    100 - {parent.custom.val1} - {parent.custom.val2} (expression binding)

  • Set grow and shrink for each label to 0.

  • Add expression bindings to the width property of each label.
    {parent.position.width} * {parent.custom.val1} / 100
    {parent.position.width} * {parent.custom.val2} / 100
    {parent.position.width} * (100 - {parent.custom.val1} - {parent.custom.val2}) / 100

  • Style the labels as required. (Using sytle classes is always recommended.)

  • You might want to set the label text tonull or "" when the width is narrow.

1 Like

No, you can keep three labels, but those labels should not be fixed. They should be dynamic based on my fault modes. For example, I showed three labels, but if I have 7 fault modes, then it should display 7 labels with their values. For instance, if the values are 25, 10, 15, 10, 10, 20, and 10, the progress bar should adjust accordingly based on the fault modes

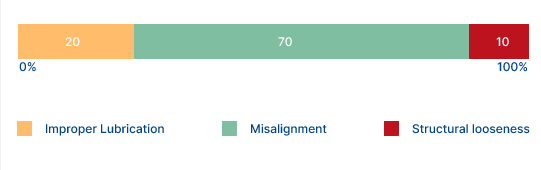
This looks like a horizontal stacked bar chart. The XY Chart component should be able to meet these requirements.

Man page: Perspective - XY Chart | Ignition User Manual

Samples showing different data values:

JSON attached.

[
  {
    "type": "ia.chart.xy",
    "version": 0,
    "props": {
      "xAxes": [
        {
          "name": "percent",
          "label": {
            "enabled": false,
            "text": "Percent",
            "color": ""
          },
          "visible": true,
          "tooltip": {
            "enabled": true,
            "text": "",
            "cornerRadius": 3,
            "pointerLength": 4,
            "background": {
              "color": "",
              "opacity": 1
            }
          },
          "inversed": false,
          "render": "value",
          "category": {
            "break": {
              "enabled": false,
              "startCategory": "",
              "endCategory": "",
              "size": 0.05
            }
          },
          "date": {
            "baseInterval": {
              "enabled": false,
              "timeUnit": "hour",
              "count": 1,
              "skipEmptyPeriods": false
            },
            "range": {
              "max": "",
              "min": "",
              "useStrict": false
            },
            "break": {
              "enabled": false,
              "startDate": "",
              "endDate": "",
              "size": 0.05
            },
            "inputFormat": "yyyy-MM-dd kk:mm:ss",
            "format": "M/d"
          },
          "value": {
            "range": {
              "max": 100,
              "min": 0,
              "useStrict": true
            },
            "logarithmic": false,
            "break": {
              "enabled": false,
              "startValue": 0,
              "endValue": 100,
              "size": 0.05
            },
            "format": "#'%'"
          },
          "appearance": {
            "opposite": true,
            "inside": false,
            "labels": {
              "color": "",
              "opacity": 1,
              "rotation": 0,
              "verticalCenter": "middle",
              "horizontalCenter": "middle"
            },
            "grid": {
              "color": "",
              "opacity": 1,
              "dashArray": "",
              "minDistance": 60,
              "position": 0.5
            },
            "font": {
              "size": "",
              "weight": 500
            }
          }
        }
      ],
      "yAxes": [
        {
          "name": "category",
          "label": {
            "enabled": false,
            "text": "category",
            "color": ""
          },
          "visible": true,
          "tooltip": {
            "enabled": true,
            "text": "",
            "cornerRadius": 3,
            "pointerLength": 4,
            "background": {
              "color": "",
              "opacity": 1
            }
          },
          "inversed": false,
          "render": "category",
          "category": {
            "break": {
              "enabled": false,
              "startCategory": "",
              "endCategory": "",
              "size": 0.05
            }
          },
          "date": {
            "baseInterval": {
              "enabled": false,
              "timeUnit": "hour",
              "count": 1,
              "skipEmptyPeriods": false
            },
            "range": {
              "max": "",
              "min": "",
              "useStrict": false
            },
            "break": {
              "enabled": false,
              "startDate": "",
              "endDate": "",
              "size": 0.05
            },
            "inputFormat": "yyyy-MM-dd kk:mm:ss",
            "format": "M/d/yyyy HH:mm:ss"
          },
          "value": {
            "range": {
              "max": "",
              "min": "",
              "useStrict": false
            },
            "logarithmic": false,
            "break": {
              "enabled": false,
              "startValue": 0,
              "endValue": 100,
              "size": 0.05
            },
            "format": "#,###.##"
          },
          "appearance": {
            "opposite": false,
            "inside": false,
            "labels": {
              "color": "",
              "opacity": 1,
              "rotation": 0,
              "verticalCenter": "middle",
              "horizontalCenter": "middle"
            },
            "grid": {
              "color": "",
              "opacity": 1,
              "dashArray": "",
              "minDistance": null,
              "position": 0.5
            },
            "font": {
              "size": "",
              "weight": 500
            }
          }
        }
      ],
      "series": [
        {
          "name": "Improper Lubrication",
          "label": {
            "text": "Improper Lubrication"
          },
          "visible": true,
          "hiddenInLegend": false,
          "defaultState": {
            "visible": true
          },
          "data": {
            "source": "data",
            "x": "improperLubrication",
            "y": "category"
          },
          "xAxis": "percent",
          "yAxis": "category",
          "zIndex": 0,
          "tooltip": {
            "enabled": true,
            "text": "{name}: [bold]{valueX}[/]%",
            "cornerRadius": 3,
            "pointerLength": 4,
            "background": {
              "color": "",
              "opacity": 1
            }
          },
          "render": "column",
          "candlestick": {
            "open": {
              "x": "",
              "y": ""
            },
            "high": {
              "x": "",
              "y": ""
            },
            "low": {
              "x": "",
              "y": ""
            },
            "appearance": {
              "fill": {
                "color": "",
                "opacity": 1
              },
              "stroke": {
                "color": "",
                "opacity": 1,
                "width": 1
              },
              "stacked": false,
              "deriveFieldsFromData": {
                "fill": {
                  "color": "",
                  "opacity": ""
                },
                "stroke": {
                  "color": "",
                  "opacity": "",
                  "width": ""
                }
              },
              "heatRules": {
                "enabled": false,
                "max": "",
                "min": "",
                "dataField": ""
              }
            }
          },
          "column": {
            "open": {
              "x": "",
              "y": ""
            },
            "appearance": {
              "fill": {
                "color": "#F6B26B",
                "opacity": 1
              },
              "stroke": {
                "color": "",
                "opacity": 1,
                "width": 1
              },
              "stacked": true,
              "width": null,
              "height": null,
              "deriveFieldsFromData": {
                "fill": {
                  "color": "",
                  "opacity": ""
                },
                "stroke": {
                  "color": "",
                  "opacity": "",
                  "width": ""
                }
              },
              "heatRules": {
                "enabled": false,
                "max": "",
                "min": "",
                "dataField": ""
              }
            }
          },
          "line": {
            "open": {
              "x": "",
              "y": ""
            },
            "appearance": {
              "connect": true,
              "tensionX": 1,
              "tensionY": 1,
              "minDistance": 0.5,
              "stroke": {
                "width": 3,
                "opacity": 1,
                "color": "",
                "dashArray": ""
              },
              "fill": {
                "opacity": 0,
                "color": ""
              },
              "bullets": [
                {
                  "enabled": false,
                  "render": "circle",
                  "width": 10,
                  "height": 10,
                  "label": {
                    "text": "{value}",
                    "position": {
                      "dx": 0,
                      "dy": 0
                    }
                  },
                  "fill": {
                    "color": "",
                    "opacity": 1
                  },
                  "stroke": {
                    "color": "",
                    "opacity": 1,
                    "width": 1
                  },
                  "rotation": 0,
                  "tooltip": {
                    "enabled": true,
                    "text": "{name}: [bold]{valueY}[/]",
                    "cornerRadius": 3,
                    "pointerLength": 4,
                    "background": {
                      "color": "",
                      "opacity": 1
                    }
                  },
                  "deriveFieldsFromData": {
                    "fill": {
                      "color": "",
                      "opacity": ""
                    },
                    "stroke": {
                      "color": "",
                      "opacity": "",
                      "width": ""
                    },
                    "rotation": ""
                  },
                  "heatRules": {
                    "enabled": false,
                    "max": 100,
                    "min": 2,
                    "dataField": ""
                  }
                }
              ]
            }
          },
          "stepLine": {
            "open": {
              "x": "",
              "y": ""
            },
            "appearance": {
              "connect": true,
              "tensionX": 1,
              "tensionY": 1,
              "minDistance": 0.5,
              "stroke": {
                "width": 3,
                "opacity": 1,
                "color": "",
                "dashArray": ""
              },
              "fill": {
                "opacity": 0,
                "color": ""
              },
              "bullets": [
                {
                  "enabled": true,
                  "render": "circle",
                  "width": 10,
                  "height": 10,
                  "label": {
                    "text": "{value}",
                    "position": {
                      "dx": 0,
                      "dy": 0
                    }
                  },
                  "fill": {
                    "color": "",
                    "opacity": 1
                  },
                  "stroke": {
                    "color": "",
                    "opacity": 1,
                    "width": 1
                  },
                  "rotation": 0,
                  "tooltip": {
                    "enabled": true,
                    "text": "{name}: [bold]{valueY}[/]",
                    "cornerRadius": 3,
                    "pointerLength": 4,
                    "background": {
                      "color": "",
                      "opacity": 1
                    }
                  },
                  "deriveFieldsFromData": {
                    "fill": {
                      "color": "",
                      "opacity": ""
                    },
                    "stroke": {
                      "color": "",
                      "opacity": "",
                      "width": ""
                    },
                    "rotation": ""
                  },
                  "heatRules": {
                    "enabled": false,
                    "max": 100,
                    "min": 2,
                    "dataField": ""
                  }
                }
              ]
            }
          }
        },
        {
          "name": "Misalignment",
          "label": {
            "text": "Misalignment"
          },
          "visible": true,
          "hiddenInLegend": false,
          "defaultState": {
            "visible": true
          },
          "data": {
            "source": "data",
            "x": "misalignment",
            "y": "category"
          },
          "xAxis": "percent",
          "yAxis": "category",
          "zIndex": 0,
          "tooltip": {
            "enabled": true,
            "text": "{name}: [bold]{valueX}[/]%",
            "cornerRadius": 3,
            "pointerLength": 4,
            "background": {
              "color": "",
              "opacity": 1
            }
          },
          "render": "column",
          "candlestick": {
            "open": {
              "x": "",
              "y": ""
            },
            "high": {
              "x": "",
              "y": ""
            },
            "low": {
              "x": "",
              "y": ""
            },
            "appearance": {
              "fill": {
                "color": "",
                "opacity": 1
              },
              "stroke": {
                "color": "",
                "opacity": 1,
                "width": 1
              },
              "stacked": false,
              "deriveFieldsFromData": {
                "fill": {
                  "color": "",
                  "opacity": ""
                },
                "stroke": {
                  "color": "",
                  "opacity": "",
                  "width": ""
                }
              },
              "heatRules": {
                "enabled": false,
                "max": "",
                "min": "",
                "dataField": ""
              }
            }
          },
          "column": {
            "open": {
              "x": "",
              "y": ""
            },
            "appearance": {
              "fill": {
                "color": "#93C47D",
                "opacity": 1
              },
              "stroke": {
                "color": "",
                "opacity": 1,
                "width": 1
              },
              "stacked": true,
              "width": null,
              "height": null,
              "deriveFieldsFromData": {
                "fill": {
                  "color": "",
                  "opacity": ""
                },
                "stroke": {
                  "color": "",
                  "opacity": "",
                  "width": ""
                }
              },
              "heatRules": {
                "enabled": false,
                "max": "",
                "min": "",
                "dataField": ""
              }
            }
          },
          "line": {
            "open": {
              "x": "",
              "y": ""
            },
            "appearance": {
              "connect": true,
              "tensionX": 1,
              "tensionY": 1,
              "minDistance": 0.5,
              "stroke": {
                "width": 3,
                "opacity": 1,
                "color": "",
                "dashArray": ""
              },
              "fill": {
                "opacity": 0,
                "color": ""
              },
              "bullets": [
                {
                  "enabled": false,
                  "render": "circle",
                  "width": 10,
                  "height": 10,
                  "label": {
                    "text": "{value}",
                    "position": {
                      "dx": 0,
                      "dy": 0
                    }
                  },
                  "fill": {
                    "color": "",
                    "opacity": 1
                  },
                  "stroke": {
                    "color": "",
                    "opacity": 1,
                    "width": 1
                  },
                  "rotation": 0,
                  "tooltip": {
                    "enabled": true,
                    "text": "{name}: [bold]{valueY}[/]",
                    "cornerRadius": 3,
                    "pointerLength": 4,
                    "background": {
                      "color": "",
                      "opacity": 1
                    }
                  },
                  "deriveFieldsFromData": {
                    "fill": {
                      "color": "",
                      "opacity": ""
                    },
                    "stroke": {
                      "color": "",
                      "opacity": "",
                      "width": ""
                    },
                    "rotation": ""
                  },
                  "heatRules": {
                    "enabled": false,
                    "max": 100,
                    "min": 2,
                    "dataField": ""
                  }
                }
              ]
            }
          },
          "stepLine": {
            "open": {
              "x": "",
              "y": ""
            },
            "appearance": {
              "connect": true,
              "tensionX": 1,
              "tensionY": 1,
              "minDistance": 0.5,
              "stroke": {
                "width": 3,
                "opacity": 1,
                "color": "",
                "dashArray": ""
              },
              "fill": {
                "opacity": 0,
                "color": ""
              },
              "bullets": [
                {
                  "enabled": true,
                  "render": "circle",
                  "width": 10,
                  "height": 10,
                  "label": {
                    "text": "{value}",
                    "position": {
                      "dx": 0,
                      "dy": 0
                    }
                  },
                  "fill": {
                    "color": "",
                    "opacity": 1
                  },
                  "stroke": {
                    "color": "",
                    "opacity": 1,
                    "width": 1
                  },
                  "rotation": 0,
                  "tooltip": {
                    "enabled": true,
                    "text": "{name}: [bold]{valueY}[/]",
                    "cornerRadius": 3,
                    "pointerLength": 4,
                    "background": {
                      "color": "",
                      "opacity": 1
                    }
                  },
                  "deriveFieldsFromData": {
                    "fill": {
                      "color": "",
                      "opacity": ""
                    },
                    "stroke": {
                      "color": "",
                      "opacity": "",
                      "width": ""
                    },
                    "rotation": ""
                  },
                  "heatRules": {
                    "enabled": false,
                    "max": 100,
                    "min": 2,
                    "dataField": ""
                  }
                }
              ]
            }
          }
        },
        {
          "name": "Structural looseness",
          "label": {
            "text": "Structural looseness"
          },
          "visible": true,
          "hiddenInLegend": false,
          "defaultState": {
            "visible": true
          },
          "data": {
            "source": "data",
            "x": "structuralLooseness",
            "y": "category"
          },
          "xAxis": "percent",
          "yAxis": "category",
          "zIndex": 0,
          "tooltip": {
            "enabled": true,
            "text": "{name}: [bold]{valueX}[/]%",
            "cornerRadius": 3,
            "pointerLength": 4,
            "background": {
              "color": "",
              "opacity": 1
            }
          },
          "render": "column",
          "candlestick": {
            "open": {
              "x": "",
              "y": ""
            },
            "high": {
              "x": "",
              "y": ""
            },
            "low": {
              "x": "",
              "y": ""
            },
            "appearance": {
              "fill": {
                "color": "",
                "opacity": 1
              },
              "stroke": {
                "color": "",
                "opacity": 1,
                "width": 1
              },
              "stacked": false,
              "deriveFieldsFromData": {
                "fill": {
                  "color": "",
                  "opacity": ""
                },
                "stroke": {
                  "color": "",
                  "opacity": "",
                  "width": ""
                }
              },
              "heatRules": {
                "enabled": false,
                "max": "",
                "min": "",
                "dataField": ""
              }
            }
          },
          "column": {
            "open": {
              "x": "",
              "y": ""
            },
            "appearance": {
              "fill": {
                "color": "#CC0000",
                "opacity": 1
              },
              "stroke": {
                "color": "",
                "opacity": 1,
                "width": 1
              },
              "stacked": true,
              "width": null,
              "height": null,
              "deriveFieldsFromData": {
                "fill": {
                  "color": "",
                  "opacity": ""
                },
                "stroke": {
                  "color": "",
                  "opacity": "",
                  "width": ""
                }
              },
              "heatRules": {
                "enabled": false,
                "max": "",
                "min": "",
                "dataField": ""
              }
            }
          },
          "line": {
            "open": {
              "x": "",
              "y": ""
            },
            "appearance": {
              "connect": true,
              "tensionX": 1,
              "tensionY": 1,
              "minDistance": 0.5,
              "stroke": {
                "width": 3,
                "opacity": 1,
                "color": "",
                "dashArray": ""
              },
              "fill": {
                "opacity": 0,
                "color": ""
              },
              "bullets": [
                {
                  "enabled": false,
                  "render": "circle",
                  "width": 10,
                  "height": 10,
                  "label": {
                    "text": "{value}",
                    "position": {
                      "dx": 0,
                      "dy": 0
                    }
                  },
                  "fill": {
                    "color": "",
                    "opacity": 1
                  },
                  "stroke": {
                    "color": "",
                    "opacity": 1,
                    "width": 1
                  },
                  "rotation": 0,
                  "tooltip": {
                    "enabled": true,
                    "text": "{name}: [bold]{valueY}[/]",
                    "cornerRadius": 3,
                    "pointerLength": 4,
                    "background": {
                      "color": "",
                      "opacity": 1
                    }
                  },
                  "deriveFieldsFromData": {
                    "fill": {
                      "color": "",
                      "opacity": ""
                    },
                    "stroke": {
                      "color": "",
                      "opacity": "",
                      "width": ""
                    },
                    "rotation": ""
                  },
                  "heatRules": {
                    "enabled": false,
                    "max": 100,
                    "min": 2,
                    "dataField": ""
                  }
                }
              ]
            }
          },
          "stepLine": {
            "open": {
              "x": "",
              "y": ""
            },
            "appearance": {
              "connect": true,
              "tensionX": 1,
              "tensionY": 1,
              "minDistance": 0.5,
              "stroke": {
                "width": 3,
                "opacity": 1,
                "color": "",
                "dashArray": ""
              },
              "fill": {
                "opacity": 0,
                "color": ""
              },
              "bullets": [
                {
                  "enabled": true,
                  "render": "circle",
                  "width": 10,
                  "height": 10,
                  "label": {
                    "text": "{value}",
                    "position": {
                      "dx": 0,
                      "dy": 0
                    }
                  },
                  "fill": {
                    "color": "",
                    "opacity": 1
                  },
                  "stroke": {
                    "color": "",
                    "opacity": 1,
                    "width": 1
                  },
                  "rotation": 0,
                  "tooltip": {
                    "enabled": true,
                    "text": "{name}: [bold]{valueY}[/]",
                    "cornerRadius": 3,
                    "pointerLength": 4,
                    "background": {
                      "color": "",
                      "opacity": 1
                    }
                  },
                  "deriveFieldsFromData": {
                    "fill": {
                      "color": "",
                      "opacity": ""
                    },
                    "stroke": {
                      "color": "",
                      "opacity": "",
                      "width": ""
                    },
                    "rotation": ""
                  },
                  "heatRules": {
                    "enabled": false,
                    "max": 100,
                    "min": 2,
                    "dataField": ""
                  }
                }
              ]
            }
          }
        }
      ],
      "style": {
        "marginRight": "100px",
        "paddingRight": "100px"
      },
      "dataSources": {
        "data": [
          {
            "category": "",
            "improperLubrication": 10,
            "misalignment": 80,
            "structuralLooseness": 10
          }
        ]
      }
    },
    "meta": {
      "name": "XYChart"
    },
    "position": {
      "x": 1254,
      "y": 11,
      "width": 925,
      "height": 179
    },
    "custom": {}
  }
]
3 Likes

Thanks, @code_skin it’s working.

Is it possible to increase the chart width? Currently, I’m using the chart in a small view, and there is too much gap on the right side compared to the left. It would be better if we could increase the width on the right side to maintain equal gaps.

Just remove the padding/margin keys from self.props.styles

{
"classes": "",
"paddingRight": "100px",
"marginRight": "100px"
}

1 Like

Thanks! Yes, I’ve got it working for all requirements. However, when I hover over the chart, it shows the key and value. By default, I want the value to be displayed on the chart. Is there an option for this?

Has anyone done? Please give an idea or a suggestion

series.x.tooltip.text

In the XY chart series, there is no option for 'x' inside the series. For the first element in series 0, the tooltip option is available but does not appear. I also tried the x-axis properties, where the tooltip text option is present, but it still does not appear inside the chart bar. Could you please elaborate on how I can try this or if there is another way to achieve it?

When I used @code_skin 's horizontal stacked chart, I was able to see the tool tip.

SInce you only want the value just set it as : [bold]{valueX}[/]%

Or is this what you want?

no, I need to show like this

image

'x' is the series number. You need to edit
series.0.tooltip.text : [bold]{valueX}[/]%
series.1.tooltip.text : [bold]{valueX}[/]%
series.2.tooltip.text : [bold]{valueX}[/]%

Yes, it is there, but it only appears when I hover the mouse over the chart. I need those values to be visible permanently when the view is opened.

You might have to do a variation of [FEATURE-10589] Perspective Bar Chart value labels - #2 by Phil_B.

Note that my Label component solution in post #2 would do this very simply.

1 Like

Yes, I saw the post, but that requirement is different. In the render option, I used column selection, whereas in post #2 they used the line option, which does not appear correctly. I tried it, but is there any option available for this? Could you please share?