Ignition V8.3 Siemens Enhanced Driver - Slow Update Rate

I am testing out the new Siemens Enhanced Driver to communicate with a S7-1500 PLC. I have the communications working, but they are very slow. It seems to take 4 to 5 seconds for the tag values from the PLC to update. I am using the symbolic addressing mode.

Prior to this I was using the third party Tanni OPC driver to communicate with the PLC using symbolic tags and didn't notice any issues with slow update rate.

Has anyone else experienced this?

When I first started testing with the new driver and only had it connected to a few tags I didn't notice the slow update rate. It was only when I switched all of the tags in the project over to using the new driver that I noticed the slow update rate. I am monitoring the seconds value of the time clock in the PLC so that I can see how often it is updating. It’ll jump 4 to 6 seconds on every update.

I’m pretty sure its not a bottleneck at the PLC because I am monitoring the same “seconds” tag using the tanni driver and its updating like clockwork every second.

How many tags are you subscribed to?

There's one known issue that slows the polling that I think will get fixed in 8.3.2 or 8.3.3. Basically, the polling is happening using a fixed delay rather than a fixed rate.

This means the next poll isn't scheduled until after the subsequent poll finishes, e.g. if you are subscribed at 1000ms, it takes 500ms for the PLC to respond with all the items, then +1000ms from the response the next request is schedule. It makes the update rate more like ~1500ms.

Other than that... not sure. You might want to work with support so they can get a better idea of your tags and setup.

1 Like

Thanks for the reply Kevin. I think I have it fixed now. Pretty sure it was network hardware related. The comms eventually stopped working altogether, so I bypassed the switch and cabled straight to the PLC and everything came back and the update rate greatly improved. Seems to be updating very reliably at around 1.5 to 2 seconds like you mentioned it would. Just a strange issue because the tanni OPC server never stopped working.

v8.3.2

We’re seeing issues with slow update rates with the new driver as well. Not just that though, but other issues like:

  • Very slow browse/re-browse e.g. 5mins + many more minutes (10-20mins) for the OPC browser to actually show the tags, constantly getting “TimeoutException”. Have tried restarting Ignition service.

“Loading” for minutes

tag qualities while in this state:

image

  • update rates range from 5-20s after writing to tags, when tag group set to 1000s subscribed
    (reading < 3k tags from the S7-1500 PLC)
  • need to confirm this, but also rebrowsing a single PLC affects other enhanced siemens driver connections as well; their tags stop updating

Which firmware is the PLC running?

v4.0.4

(Disclaimer: I know nothing about Siemens - all info is 2nd hand through a colleague)

Interested to see if [IGN-13789] [null, Bad_NotConnected("Communication with the data source is defined, but not established, and there is no last known value available."), - #13 by Cody_Morgan is related, there seems to be some fun in the firmware revisions.

Nah we’re not seeing those errors in the logs i.e. we’re not seeing AGL40_SYMBOLIC_NOT_APPLICABLE, we’re seeing AGL40_SYMBOLIC_PATH_UNKNOWN_FIELD

This usually means the path to the tag on the PLC is wrong. You can see this tag path in the OPC Item Path. This probably shouldn't happen when dragging and dropping from the OPC Browser, unless you have changed the tag structure on the PLC after browsing.

What is the latency like to the PLC? Is the PLC very busy with other things? You can likely avoid the timeout exception by increasing the timeout in the device connection config on the gateway. This might indirectly make loading symbols faster by not repeatedly failing with timeouts until it is successful.

Hmm, this sounds odd. I don't recall anything off hand that would cause this on the driver side. Are the other connections to the same physical PLC?

The path is definitely correct, however I believe this is due to the OPC-UA server still trying to figure out the connection to the PLC. It took in the vacinity of 20-30mins to finally connect and display tags in the opc browser in our dev environment for that single PLC :grimacing: 5mins to load the symbols, then another 15+mins for the tags to finally appear in the opc browser. We only have 2 PLC connections at the moment.

I’m not sure how to check the PLC latency, are you looking for something specific? I’m used to AB PLCs which have a dedicated comms CPU. I don’t know if it’s the same for Siemens.

Yeah, apparently v4 firmware for the S7-1500's is off to a rocky start. I haven't repro'd, but allegedly with v4.0.4, "The PLC may terminate the connection when two simultaneous connections read data larger than approximately 1300 bytes per request at short intervals."

If the connection is dropped abruptly while we're in the middle of reading, you'll likely see errors similar to this thread: Siemens Symbolic disconnect after adding certain tags

I meant network latency between the gateway and PLC. Just ping the PLC from the gateway, you should see roundtrip time in milliseconds. Performance starts to tank as the network latency between the gateway and the PLC increases.

Do the AGL40_SYMBOLIC_PATH_UNKNOWN_FIELD errors eventually stop repeating? This error comes directly from the AGLink library when we attempt to resolve a node by its path. We shouldn't be attempting to resolve a node by its path until the symbols have completely loaded. If you stop getting those errors, I'm not sure what is going on.

5mins to load the symbols, then another 15+mins for the tags to finally appear in the opc browser

5 minutes to load the symbols could be explained by a slow network or PLC that is slow to respond. But, after the symbols have loaded, I'm not sure we need to make additional requests to the PLC for the OPC Browser to work. IIRC, all of the information we need for browsing is included in the symbol info. I'll have to take a closer look to see what could be causing this slowdown. As a sanity check, what does the resource usage on your gateway look like?

Resource usage in the web portal for CPU and memory are good

These are the ping response times for both PLCs (1ms response for both):

I’m told that there aren’t any more AGL40_SYMBOLIC_PATH_UNKNOWN_FIELD logged errors now after connections have come good / tags are reading values, and these opc item paths definitely do exist.

I don't have a good explanation for this. Do you mind sharing your logs via this Dropbox ?

EDIT: I just realized that you were seeing AGL40_SYMBOLIC_PATH_UNKNOWN_FIELD before clicking the "Refresh Browse" button. It's totally expected to see this error if you have created the tags on the PLC and on the gateway before clicking "Refresh Browse". (The paths do not exist in the symbol information we have). The expected behavior is that those messages should immediately stop once the symbols have been unloaded. Once the symbols have successfully loaded, then those tags should start working properly.

What I am still unable to explain is all of the slowness. Even if the PLC is slow, I wouldn't expect this to impact the OPC Browser once the symbols have loaded. I'll poke around to see if I can repro, logs might be useful.

Hi all,

I am the aforementioned “Colleague,” Nick mentioned. I’ve uploaded a diagnostic bundle to hopefully help out. Just a heads-up I do have a support ticket submitted and working with support to try get some of these issues resolved (more so the tag rebrowsing than the update rate).

Regarding the slow update rate, here’s something I noticed during testing:

I placed all of my tags in a tag group with an update rate of 10s and 1 tag in a different tag group with an update rate of 500ms. What occurred is that the 1 tag does not update for a while and then proceeds to update 3-4 times quickly before stopping. It seems similar to what was mentioned previously, where the next poll does not occur until the previous poll has finished.

A temporary work-around I (and Nick) found was to use a leased tag group where all my tags update at 10s unless they’re displayed on the screen, in which case they update at 500ms. I am still unsure how this affects my alarms - I might need to put them on a separate tag group to update every 1-2s.

Hopefully this helps~

2 Likes

We also tried setting the mode to polled rather than subscribed, set to 1000ms, and the tags seemed to update every 2000ms. If we set it to subscribed with the same rate, they were updating every 4000-5000ms

Sounds like you're trying to poll faster than the PLC can support, plus you were running into the fixed delay vs fixed rate issue that should be fixed in 8.3.2.

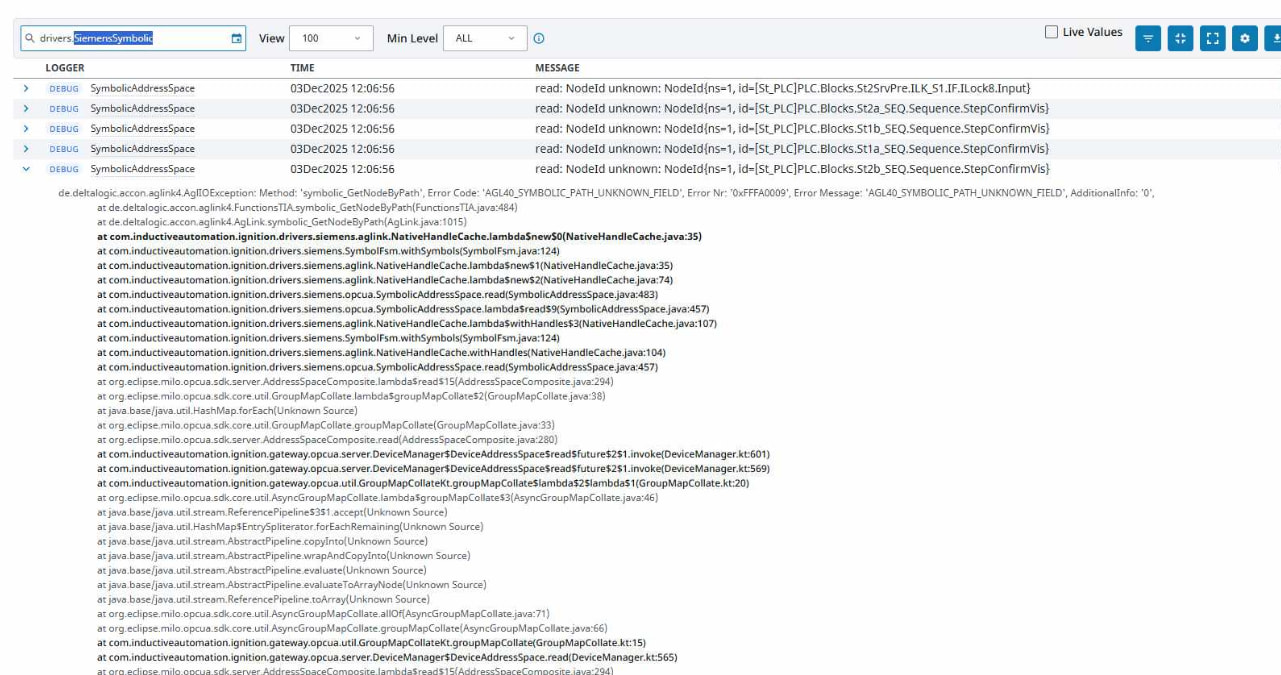
Thanks Rohan, I had seen your support ticket come in, but I didn't realize Nick was referring to the same scenario. I've got the logs you've uploaded to my dropbox, as well as all of the info you've submitted in the ticket.

I placed all of my tags in a tag group with an update rate of 10s and 1 tag in a different tag group with an update rate of 500ms. What occurred is that the 1 tag does not update for a while and then proceeds to update 3-4 times quickly before stopping. It seems similar to what was mentioned previously, where the next poll does not occur until the previous poll has finished.

This is somewhat expected. If you're reading a small tag group at a frequent rate, it can read multiple times before it is eventually interrupted by a larger tag group at a slower rate. While the large tag group's read request is in progress, the small tag group's request will have to wait.

As of 8.3.2, the Siemens driver makes a read request for all of the tags in your subscribed tag group at a fixed rate. (Technically several small read requests, one would be too large for a PDU.. but for simplicity's sake, let's consider it a single read request). It has to wait for that request to complete (i.e- get a response) before it can make another request. So, if you have a 10s tag group with 3k tags, the driver will read those 3k tags every 10 seconds. If it takes 6 to 7 seconds to actually read those tags, then another read request from another tag group can't start until 6-7 seconds later (when the large one finishes). If that second tag group is at a rate of 500 ms, it could update 3-4 times before the next large tag group request blocks it again. An overly simplified sequence would look something like this:

  1. Large tag group submits large read request to driver
  2. Small tag group submits small read request to driver
  3. Driver submits large read request to PLC
  4. Driver waits until it receives large read response from PLC
  5. Driver receives large read response from PLC
  6. Driver submits small read request to PLC
  7. Driver waits until it receives small read response from PLC8.
  8. Driver receives small read response from PLC
  9. Small tag group submits small read request to driver
    ...so on, and so on...

So, what can we (as a user) do about this? A couple of options, both are a pain, but might help:

  1. Split tags across multiple device connections.
    • Each device connection would get its own connection to the PLC, and requests for tags from one device connection wouldn't have to wait on requests from another device connection.
    • This only scales so far-- testing on one of our PLCs shows that the PLC itself can still only process one request at a time. (Behavior may differ based on model :person_shrugging: )
    • You might be about to say, "Wait, if the PLC can only process one request at a time, how would this help at all?" Remember how I mentioned that larger requests actually get broken up into many small requests? Well, the driver has to treat that as one larger request because of how we're using the AgLink library, but with multiple device connections, those smaller requests to the PLC can be interleaved with each other.
  2. Replace large tag groups with many small tag groups at similar (but different) rates. Using many smaller tag groups at similar rates would allow the driver to potentially interleave requests from more frequent groups.
    • This is will be much less effective than having multiple connections, because the more frequent requests wouldn't have priority over the slower requests, and several slow requests can't be reliably spaced out from each other. So, even if you do this, you may end up waiting on multiple slower requests. But, Siemens PLCs have a limit to the number of connections that can be made, so this might be worth a try if you're in a pinch. Probably not.

What can we (as developers at IA) do about this? A couple of things, but they're not planned yet. I have done some testing/prototyping, so it's on the radar. Just not sure when we can actually get something in:

  1. Allow a configurable number simultaneous connections/requests to be made to the PLC. (I have prototyped this, but it's not close to production)
    • If a user has multiple tag groups, this could give a similar behavior to configuring multiple device connections.
    • We could maybe try to be smart and split up large requests from a single tag group across multiple connections, but if the PLC can only process one at a time, this won't really help for large requests, because we still won't be able to update any of the tags until the entire request completes.
  2. Implement a better subscription model. (This is something we want to do, for multiple reasons, but I haven't prototyped this yet. So, the benefits below are theoretical might work)
    • With a better subscription model, we could probably update tags as values come in from the PLC.
      • We could try to split large requests into smaller requests before giving to AgLink, and update the tags for each of those smaller requests as they complete.

We also tried setting the mode to polled rather than subscribed, set to 1000ms, and the tags seemed to update every 2000ms. If we set it to subscribed with the same rate, they were updating every 4000-5000ms

This doesn't make sense to me. Subscribed should be faster than polled, especially in 8.3.2. Polling is still fixed delay, but subscribed is now fixed rate. If you have a 1000ms tag group, and it takes 2 seconds to actually read those tags on the PLC, you should see the tags updating every ~2 seconds with subscribed, and every ~3 seconds with polling. Also, polled mode has some additional overhead in the OPC server that Subscribed mode doesn't have.

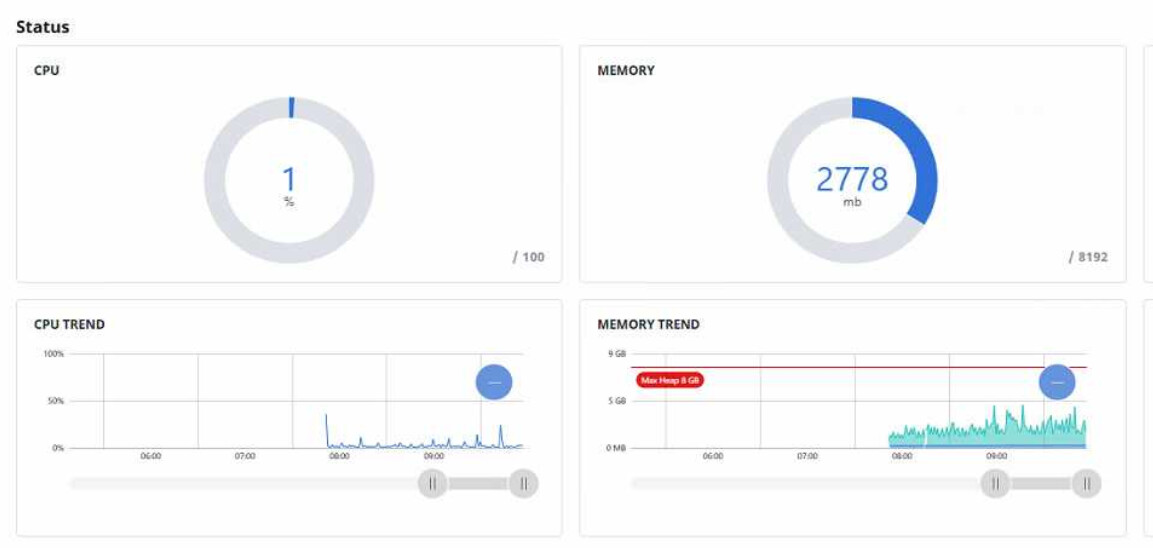
All that being said, I really wouldn't expect it to take near this long to read 3k tags on the PLC. Are there several other clients connecting/reading from the PLC at the same time? All my testing was done with a PLC doing no other work and serving no other clients, so obviously my results will differ from a PLC in production, I'm just surprised that it's this slow for you.

1 Like

I think you need to maintain separate queues of PDU-size requests for each subscription interval (perhaps with additional queues for reads and writes), and dispatch fairly (round-robin in my drivers) from non-empty queues.

That interleaves requests at different poll rates, but punishes configurations where too many requests are at the faster intervals. Without holding up the faster paces.

If you add concurrent channels, have them draw from the same queue.

1 Like

This is a good idea, but I'm not sure if we can accurately build PDU sized requests for S7+. We might be able to figure it out, but if we get it wrong, it could really hamper performance.

This would also require a proper subscription model, instead of the "dumb" one we have now.

I'll chat with Kevin about it sometime. I'd be more inclined to do something simple, putting more burden on users to optimize. But, we need to better equip users so that they can more easily optimize.