In 8.1.47 in Vision:
I’m strugging with classic chart configuration. I want to eliminate areas in the graph where there is no data to display. It looks like this:

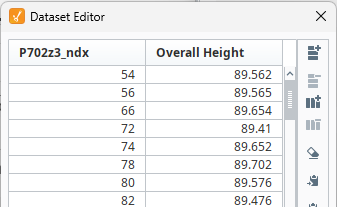
The MSSQL table contains data from several process cells. It includes the process cell name, measurement result, an index/row number, and a timestamp (SQL datatime). Like this:
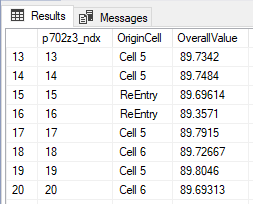
My query for the chart returns data for just one selected line, so the index numbers are sequential but some are missing since I’m not returning data for all lines. Like this:
I’ve tried to chart the data by treating the Index numbers as catagories. I config the X axis to be a catagory-type axis and configure that axis to be used in the dataset properties tab.
When I save that configuration I get the following errors:
Invalid renderer type for dataset "Data" on chart "Chart 2". Please use XY renderer.
Axis 'Catatory2' is the wrong type.
It is a CategoryAxis and it must be a ValueAxis
ClassCastException: class org.jfree.chart.plot.PiePlot cannot be cast to class org.jfree.chart.plot.XYPlot (org.jfree.chart.plot.PiePlot and org.jfree.chart.plot.XYPlot are in unnamed module of loader java.net.URLClassLoader @a643a7b)
I’ve also tried CAST and CONVERT on the Index number to convert it to a string in the chart dataset. When I do that I only get the last error ClassCastException.
I’m missing something in either the configuration or the dataset, but I can’t figure it out.
What am I missing here? Anyone have any suggestions?