Hello everyone, I am trying to bind the expression tags with a power chart but it is not displaying for some reasons. Please help me with this. The goal is to display On is green, Off is red.


What is your historical provider path for the historical data for those tags?
For my pre-made power charts my data\source for the pens points to a historical provider, not the tag path.
- Historical Provider Path: My history provider is named
Sample_SQLite_Database, and it's set as the history provider for the 'h3_on' and 'h3_off' tags (confirmed in their Tag Editor > History section). The database connectionSample_SQLite_Databaseis status 'Connected' in the Gateway. The JDBC Connect URL for this provider isjdbc:sqlite:${data}/local/quickstart/samplequickstart.db. - Pen Source Binding: I am using the tag path for the pens:
path: "[default]H3_UptimeDowntime/h3_on"tagProvider: "default"historyProvider: "Sample_SQLite_Database"
Should I use the history provider to replace the tag path?
Yes.
To make it easy just put your deisgner in live mode with theplay button, add your tags using the browser and then go out of live mode. Should have the path in there after that.
Have you tried adding a point via the browse tags portion of the power chart? Assuming the tag is working in the historian then it's likely your tag path isn't correct.
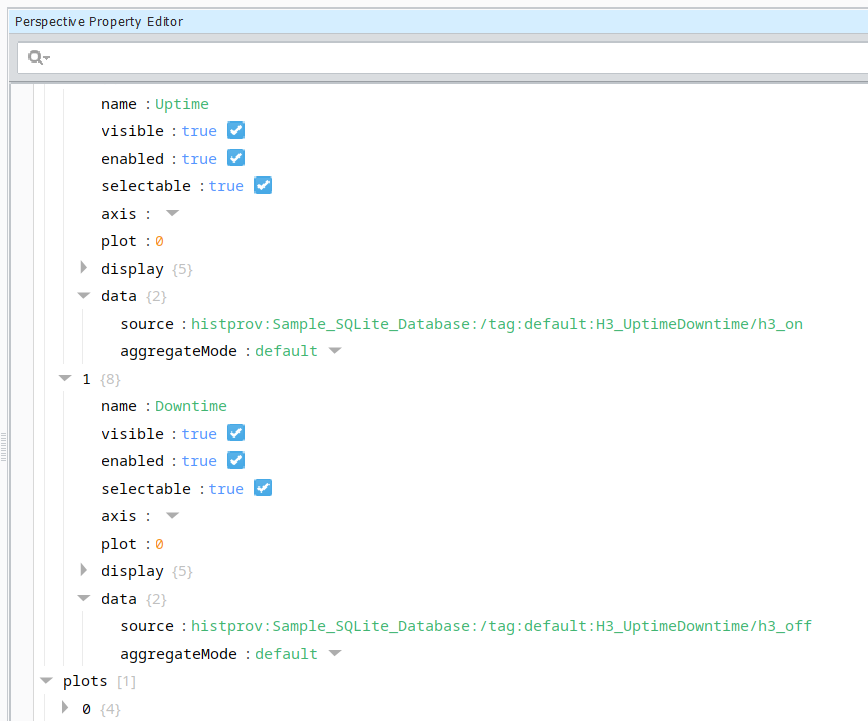
It should look something along these lines:
histprov:{nameDatabase}:/drv:{nameGateway}:{nameProvider}:/tag:folder1/folder2/tagname/status


Can you post a pic of those tags history settings? That error in the log makes me think something is off there.


Remove the {} brackets.
Try this path: histprov:Sample_SQLite_Database:/drv:Master_SCADA:default:/tag:H3_UptimeDowntime/h3_off

