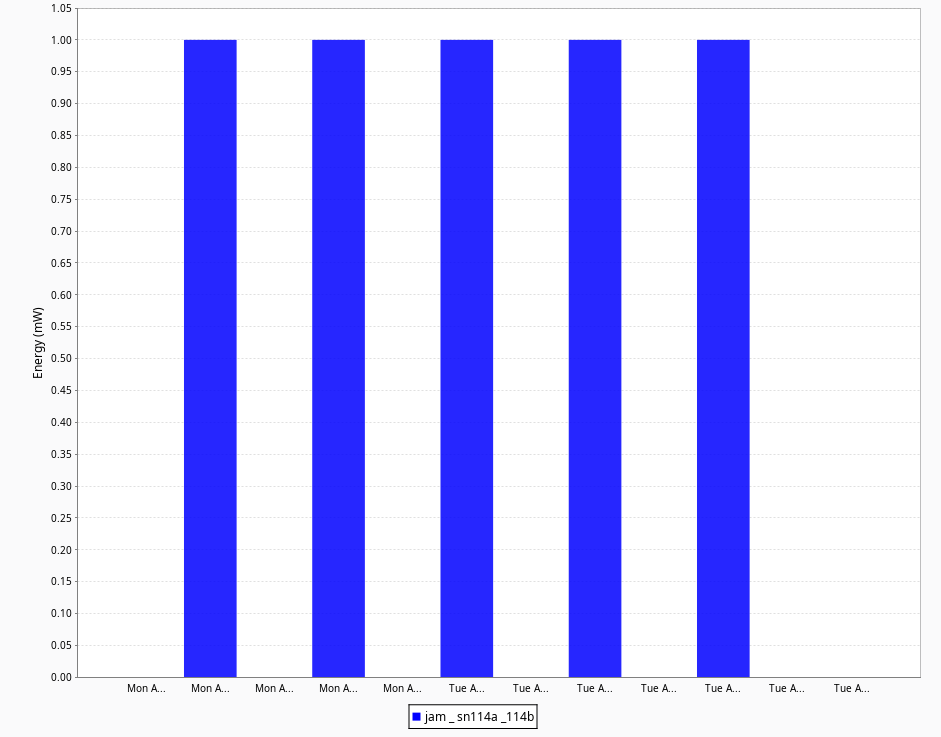
I am recording a boolean tag that is high whenever a jam event occurs for a specific location. In a bar chart object in Vision I can select the data from tag history and when using aggregate mode closest value I can see every 0-1 and 1-0 transition:

I’m trying to look at the number of events in some period, for testing using real time last 1 day of data. My first thought was to use aggregate data “Count On” but selecting this does not change my data dataset at all. I’d like to have one bar with the count, once that is working more sensors will be added.
Must be missing something here, it looks like it’s trying to graph over time instead of grouped by tag. I tried setting Extract Order to column, which I think would work if I could get one row of aggregate counts, instead of my data still showing period 0 and 1 instead of the count.