Hello, I am having trouble using the system.tag.queryTagHistory() function, specifically the ‘interval’ argument and the startDate and endDate arguments.
I have a script that looks at multiple tags that correspond to the runtime of some machines. The tags are true when the machine is powered on, and false when they are off. I am using system.tag.queryTagHistory() to tell me how long each machine is powered on over the course of multiple shifts in the day.
if shiftAll:
	startTime = event.source.parent.getComponent('Date Range').startDate
	endTime = event.source.parent.getComponent('Date Range').endDate
	interval = 24
if shift1:
	startTime = event.source.parent.getComponent('Date Range').startDate # set to 00:00
	startTime = system.date.addMinutes(startTime, 360)  # start set to 06:00
	endTime = system.date.addMinutes(startTime, 510)    # end set to 14:30
	interval = 8.5
if shift2:
	startTime = event.source.parent.getComponent('Date Range').startDate  # set to 00:00
	startTime = system.date.addMinutes(startTime, 840) # start set to 14:00
	endTime = system.date.addMinutes(startTime, 510) # end set to 22:30
	interval = 8.5
if shift3:
	startTime = event.source.parent.getComponent('Date Range').startDate
	startTime = system.date.addMinutes(startTime, 1320) # start set to 22:00
	endTime = system.date.addMinutes(startTime, 510) # end set to
	interval = 8.5

dsDuration = system.tag.queryTagHistory(paths=paths, startDate = startTime, endDate = endTime, intervalHours = interval, aggregationMode="DurationOn", returnFormat="Wide")
dsPercent = system.tag.queryTagHistory(paths=paths, startDate = startTime, endDate = endTime, intervalHours = interval, aggregationMode="Average", returnFormat="Wide")
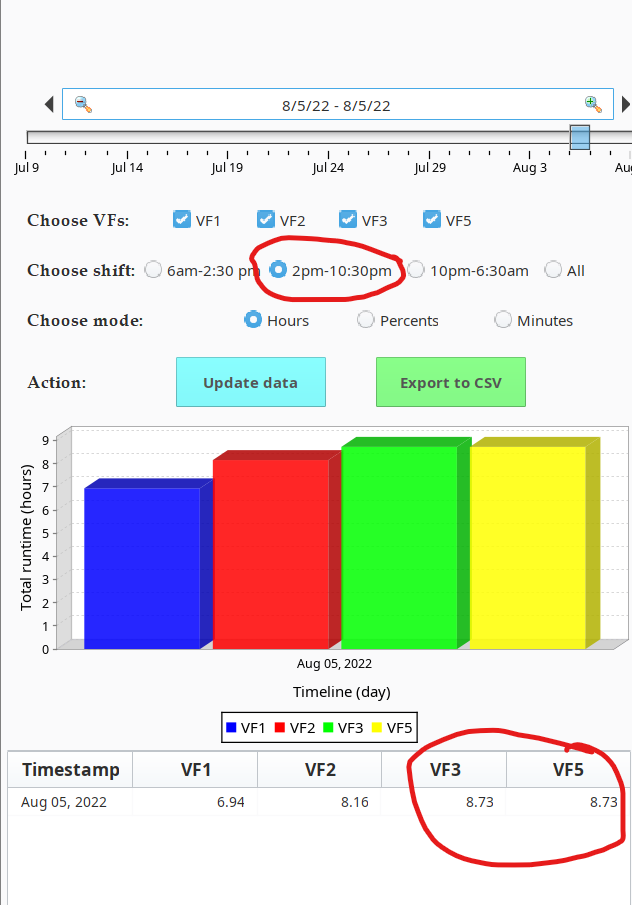
Currently the interval time is set to 8.5 hours, because that is how long each shift is, and the start and endDate arguments are set to the start and end times of the shift. However, the function is returning runtimes that are sometimes longer than 8.5 hours, which does not make sense.
Example of what i mean:
Here is the whole script:
#bind the start and end date to the date slider.
startTime = event.source.parent.getComponent('Date Range').startDate
endTime = event.source.parent.getComponent('Date Range').endDate
system.date.format(startTime, "yyyy-MM-dd HH:mm:ss")
system.date.format(endTime, "yyyy-MM-dd HH:mm:ss")

#get the name of the vf
vf1 = event.source.parent.getComponent('VF_checkboxes').getComponent('VF1_checkbox').text
vf2 = event.source.parent.getComponent('VF_checkboxes').getComponent('VF2_checkbox').text
vf3 = event.source.parent.getComponent('VF_checkboxes').getComponent('VF3_checkbox').text
vf5 = event.source.parent.getComponent('VF_checkboxes').getComponent('VF5_checkbox').text

#get the boolean for the check boxes.
check1 = event.source.parent.getComponent('VF_checkboxes').getComponent('VF1_checkbox').selected
check2 = event.source.parent.getComponent('VF_checkboxes').getComponent('VF2_checkbox').selected
check3 = event.source.parent.getComponent('VF_checkboxes').getComponent('VF3_checkbox').selected
check5 = event.source.parent.getComponent('VF_checkboxes').getComponent('VF5_checkbox').selected

#get the boolean for the shift checkboxes
shift1 = event.source.parent.getComponent('Shift selector').getComponent('Shift1').selected # 9 - 5
shift2 = event.source.parent.getComponent('Shift selector').getComponent('Shift2').selected # 5 - 1
shift3 = event.source.parent.getComponent('Shift selector').getComponent('Shift3').selected # 1 - 9
shiftAll = event.source.parent.getComponent('Shift selector').getComponent('All').selected
#check shift selected and specify times

if shiftAll:
	startTime = event.source.parent.getComponent('Date Range').startDate
	endTime = event.source.parent.getComponent('Date Range').endDate
	interval = 24
	print(startTime)
	print(endTime)
if shift1:
	startTime = event.source.parent.getComponent('Date Range').startDate # set to 00:00
	startTime = system.date.addMinutes(startTime, 360)  # start set to 06:00
	endTime = system.date.addMinutes(startTime, 510)    # end set to 14:30
	interval = 8.5
	print(startTime)
	print(endTime)
if shift2:
	startTime = event.source.parent.getComponent('Date Range').startDate  # set to 00:00
	startTime = system.date.addMinutes(startTime, 840) # start set to 14:00
	endTime = system.date.addMinutes(startTime, 510) # end set to 22:30
	interval = 8.5
	print(startTime)
	print(endTime)
if shift3:
	startTime = event.source.parent.getComponent('Date Range').startDate
	startTime = system.date.addMinutes(startTime, 1320) # start set to 22:00
	endTime = system.date.addMinutes(startTime, 510) # end set to
	interval = 8.5
	print(startTime)
	print(endTime)
#get the boolean value from the radio buttons
hourCheck = event.source.parent.getComponent('Mode').getComponent('Runtime Hours').selected
percentCheck = event.source.parent.getComponent('Mode').getComponent('Runtime Percentage').selected
minuteCheck = event.source.parent.getComponent('Mode').getComponent('Runtime Minutes').selected


#initialize a boolean paths array.
boolVFs = [(check1, vf1), (check2, vf2), (check3, vf3), (check5, vf5)]     #checks which vf checkboxes are selected / which vfs you want data for

#initialize the paths for tag history query.
paths = []   #an array of paths for selected vfs    -----  ['vf1/HMI_AutoCycleRunning', 'vf2/HMI_Auto........']
for check, vf in boolVFs:
	if check:
		paths.append(vf + "/HMI_AutoCycleRunning")

#initialize the dataset for durations and time-weighted average.
dsDuration = system.tag.queryTagHistory(paths=paths, startDate = startTime, endDate = endTime, intervalHours = interval, aggregationMode="DurationOn", returnFormat="Wide")#checks how long a vf in paths[] has been true / how long vf has been "on"
dsPercent = system.tag.queryTagHistory(paths=paths, startDate = startTime, endDate = endTime, intervalHours = interval, aggregationMode="Average", returnFormat="Wide")
#build the headers
headers = ["Timestamp"]
for check, vf in boolVFs:
	if check:
		headers.append(vf)	#headers will = an arry with [timestamp, names of vfs..., etc] so it will look like headers for table

#manipulate the data to output the right form.
manipulatedDataTable = []
manipulatedDataChart = []
for row in range(dsDuration.getRowCount()):    #row is number of vfs that we want to display data for/ how many 'durationsOns' there are in the dataset
	timestamp = dsDuration.getValueAt(row, 0) #returns the duration of a vf, for each vf/row
	builderTable = [timestamp] # first column is the timestamp/duration on
	builderChart = [timestamp] # first column is the timestamp/ duration on
	col = 1
	for check, vf in boolVFs:
		if check:
			#if choose hour mode.
			if hourCheck:
				duration = round((dsDuration.getValueAt(row, col)  / 3600.00), 2)  #finds duration on in seconds, and converts to hours and rounds to nearest hundredth of an hour
				builderTable.append(duration) #appends the duration for the current vf in the for loop
				builderChart.append(duration) #does the same thing as above
			if minuteCheck:
				duration = round((dsDuration.getValueAt(row, col) / 60), 2)
				builderTable.append(duration)
				builderChart.append(duration)
			if percentCheck:
				percent = round(dsPercent.getValueAt(row, col) * 100.00, 2)
				builderTable.append(percent)
				builderChart.append(percent)
			#update column index
			col += 1
			#print(manipulatedDataTable)
	manipulatedDataTable.append(builderTable) #appends the column of data containing the timestamps for all the selected vfs
	manipulatedDataChart.append(builderChart)
	print(manipulatedDataTable)
#print(manipulatedDataTable)
#output the manipulated data for the table.
newDSTable = system.dataset.toDataSet(headers, manipulatedDataTable)
newDSTable = system.dataset.formatDates(newDSTable, "MMM dd, yyyy")
event.source.parent.getComponent('Runtime table').data = newDSTable #assigns new data table to the 'Runtime table' element in ignition


#output the data for the chart
newDSChart = system.dataset.toDataSet(headers, manipulatedDataChart)
newDSChart = system.dataset.formatDates(newDSChart, "MMM dd, yyyy")
event.source.parent.getComponent('Bar Chart').data = newDSChart
event.source.parent.getComponent('Bar Chart').categoryLabel = "Timeline (day)"
if hourCheck:
	event.source.parent.getComponent('Bar Chart').valueLabel = "Total runtime (hours)"
if minuteCheck:
	event.source.parent.getComponent('Bar Chart').valueLabel = "Total runtime (minutes)"
if percentCheck:
	event.source.parent.getComponent('Bar Chart').valueLabel = "Percentage runtime (%)"