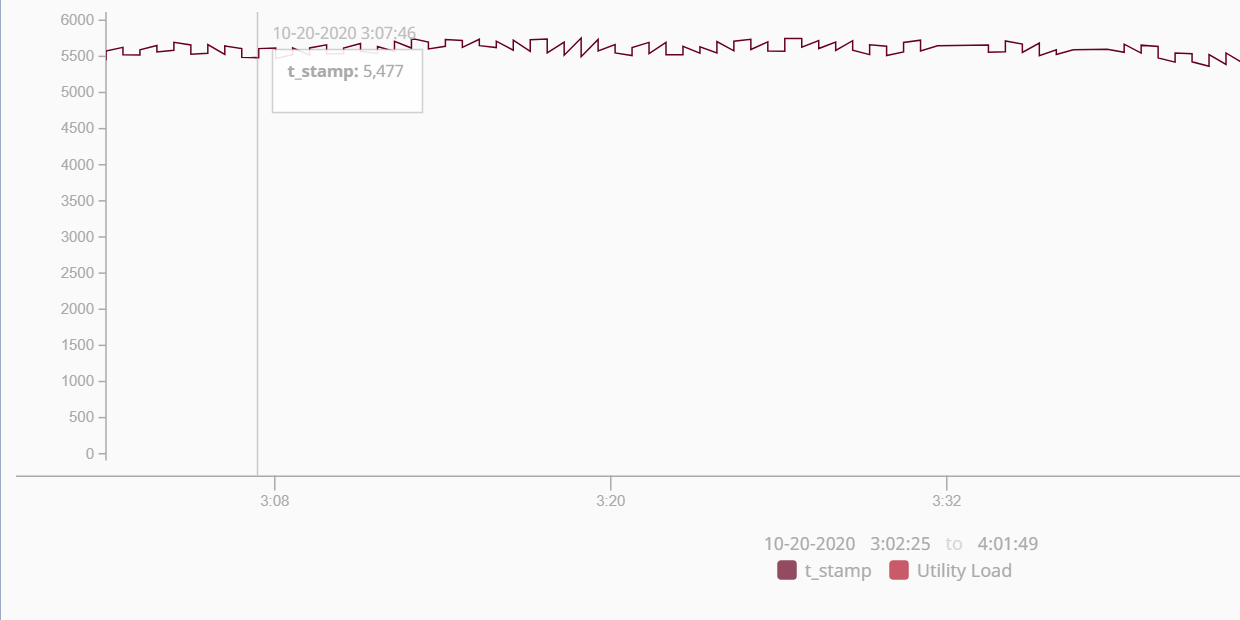
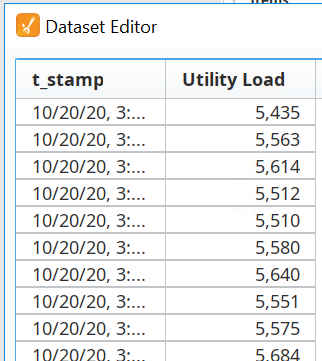
I have a time series chart in Ignition 8.1 RC3. The data is a tag history binding to a dataset. The chart graphs the data correctly, but, when I either hover over the graph or enable the legend, the data is labeled as t_stamp instead of its correct column name of Utility Load. I’ve tried assigning the column names in the trends section of the plot, but that does not correct the situation. It appears that the chart thinks that the data column is called t_stamp and not Utility Load. I’ve attached screenshots of the dataset from the tag history binding as well as the chart showing the hover display showing the incorrect data. Any assistance with getting the chart to function correctly would be appreciated.