I never noticed this until one of my users asked why it was happening.
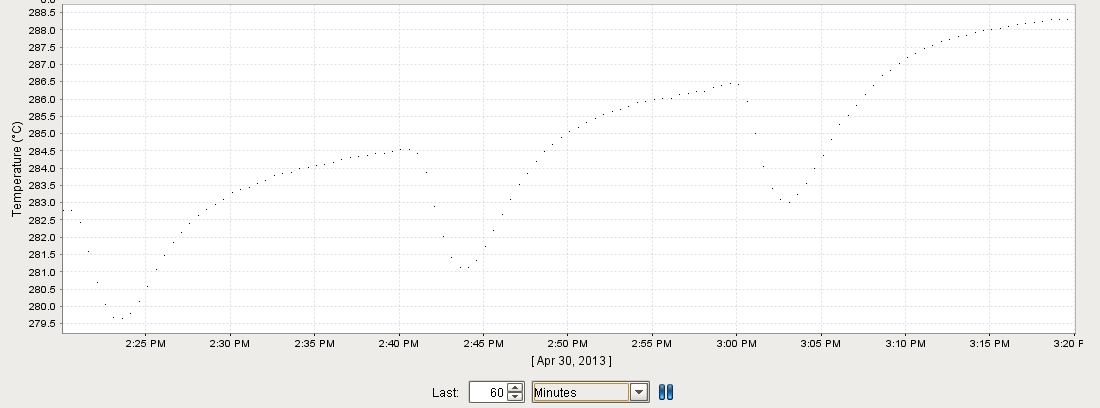
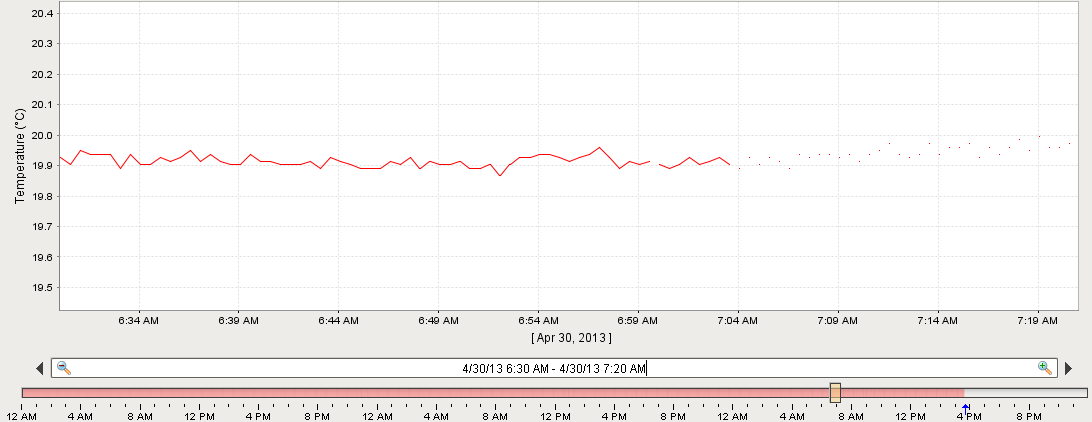
I have an Easy Chart with a number of pens on it with the render style set to “Line with Gaps”. Sometimes the line renders as individual pixels as in the attached screenshots. Zooming in with the mouse can sometimes cause the chart to redraw with a solid, continuous line. I’ve checked the data and there are no gaps that I can find.
Any idea why this could be happening? The obvious thing to do is to go in and change the render style to just “Line”, which I plan to do when I get a chance.