Another option is to build a WebDev endpoint for accessing the data; have the client query the endpoint and put the results into the Chart's datasets.
I haven't tested it (I don't do much with the WebDev module), but I would imagine taking the query load out of the Perspective session would be a good thing.
Not sure if you can control this but the tooltip in the 'Add Object Member' menu for options.plugins.tooltip.external takes up the entire width of my screen:
Yup, it'd be nice if it wrapped on its own, but we can add some new lines in there.
The best place to report these kind of issues is on GitHub Issues; it's much easier to see what's outstanding and to get flagged when issues are resolved.
Data loading via JS proxy seems pretty heavyweight, at least on our gateway. How many cores do you have on your gateway when testing/developing the module?
Data fetch from our db is taking about 1/5th to 1/10th the time it takes to actually load the data into the chart via JS proxy. (200 ms fetch vs 2s js execute)
Did you do any performance comparison between having an append method on the chart component vs doing the append via a JS Proxy script?
Are you seeing load on the gateway, or on the client?
Nothing crazy, an Intel Core Ultra 7 165H and 96GB RAM.
The only timing difference between a dedicated component method, and building your own using the proxy methods is construction of the JavaScript function from a string, which is pretty negligible for "one-off" function calls.
Either way, your array of data points needs to be serialized and sent over the WebSocket. How many points are you trying to send at once?
// https://github.com/mussonindustrial/embr/blob/240bc46220477d5aabab6e5d0fc17499cdd8ef4a/libraries/perspective/gateway/src/main/kotlin/com/mussonindustrial/embr/perspective/gateway/component/ComponentDelegateJavaScriptProxy.kt
private fun runJavaScript(
    function: String,
    args: PyDictionary?,
    callback: PyFunction? = null,
): CompletableFuture<PyObject?> {
  ...
  delegate.fireEvent(MESSAGE_RUN, JavaScriptRunMsg(id, property, function, args).getPayload())
  ...
}

class JavaScriptRunMsg(
    private val id: String,
    private val property: String,
    private val function: String,
    private val args: PyDictionary?
) {
    fun getPayload(): JsonObject {
        return JsonObject().apply {
            addProperty("id", id)
            addProperty("property", property)
            addProperty("function", function)
            add("args", TypeUtilities.pyToGson(args))
        }
    }
}
My current batch logic executes in chunks of 10k or less, but runs as many times as needed for the total amount of points.
Currently somewhere in the neighborhood of ~40k total points sticks our gateway cpu to ~27% from the designer session and an active web browser session
Anything higher than 150k total seems to max our gateway cpu and I'll get drift warnings if I have it running at a set rate.
I believe we are running 2 cores 4 threads on our VM ( small deployment overall, <25 machines total, most are pulling general state info and alarms and nothing else). It may just be that I'm trying to do too much with too little.
I'm guessing this is probably what is chewing through the cpu time the most.
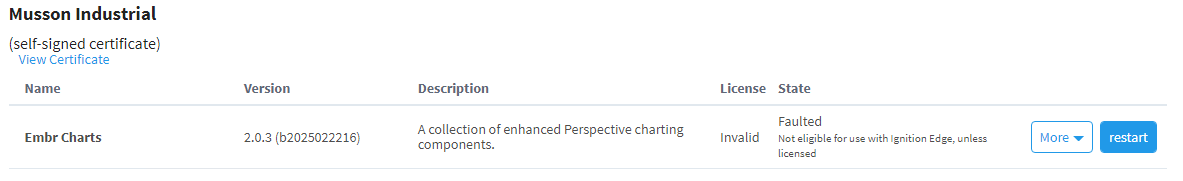
I've just installed the Embr-Charts module on an edge platform but I'm getting the licensing error in the snippet below. As this is a free module i didn't think there would be a option to buy a license. Also, the edge platform already has a valid license running. Would this issue be in the chart module or in the Edge?
'Faulted. not eligible for use in Ignition Edge unless licensed'
@Alex_Godfrey embr charts is not one of the permitted third party modules for edge.
From the docs:
Edge's core functionality and products largely determine which modules run on the platform. Third-party modules will not run on an Edge Gateway, with the exception of any third-party module explicitly stated by a product, such as the Edge IIoT product.
It’s an Edge issue. There’s no technical reason why the module won’t work on Edge, except for IA’s restrictive Edge licensing model.
While there’s been some movement on 3rd party modules for Edge, I don’t expect open-source modules to ever be approved and it’s not something I’m interested in pursuing.
Actually this dev server is set up mostly™ correct (Same for our prod). Only Ignition lives in this VM, DB is a separate VM (likely same physical server, IT hasn't really given details.) No idea if they provisioned the VM correctly though.
One thing all the Embr modules could benefit from is improved trace logging, there’s not much information emitted to help with debugging these kinds of issues.
Possible challenge for you if you want it: Tooltips spread across multiple vertically stacked scales. I'm finding a lot of requests online for the ability to be added to the tooltips plugin, but no actual solutions.
I'm plugging away at an approach I think will work by using the external callback to create as many HTML tooltips as there are used scales. (While typing this I just thought of the issue of determining if the scale is actually vertically stacked or grouped with another scale. Problems for later)
edit: I might be on to something. And because they are HTML elements I can assign style classes to them.
Alright, I managed to get multiple tooltips working, but I'm not entirely happy on the method used to create the table of items for each tooltip. This pass does not have titles or pre/post body text.
I based it on the HTML tooltip example for Chart.js which removes all the table row items from the DOM then appends new ones.
I tried doing modifications to the text value of the rows instead of replacing the items but I would lose the colored square for each item.
My math for determining if I should flip which side of the x-trace line the tooltip also leaves something to be desired.
This goes into the external property of props.plugins.tooltip.
External Multiple Tooltip Handler
(context) => {

	const getOrCreateTooltip = (chart, axisId) => {
	  let toolTipEl = chart.canvas.parentNode.querySelector('div #tt_'+axisId);

	  if (!toolTipEl) {
		toolTipEl = document.createElement('div');
		toolTipEl.id = "tt_" + axisId;
		toolTipEl.classList.add('psc-trendsurfer\/Tooltip\/container')
		toolTipEl.style.opacity = 1;
		toolTipEl.style.pointerEvents = 'none';
		toolTipEl.style.position = 'absolute';
		toolTipEl.style.transform = 'translate(-50%, 0)';
		toolTipEl.style.transition = 'all .1s ease';
		toolTipEl.style.fontSize = '12px';


		chart.canvas.parentNode.appendChild(toolTipEl);
	  };

	  return toolTipEl;
  };


	const createTooltipItem = (colors, itemText, options) => {

		const colorBlock = document.createElement('span');
		colorBlock.classList.add('psc-trendsurfer\/Tooltip\/itemIndicator');
		colorBlock.style.background = colors.backgroundColor;
		colorBlock.style.borderColor = colors.borderColor;
		colorBlock.style.borderWidth = '2px';
		colorBlock.style.marginRight = '10px';
		colorBlock.style.height = options.boxHeight + 'px' || '10px';
		colorBlock.style.width = options.boxWidth + 'px' || '10px';
		colorBlock.style.display = 'inline-block';

		const tr = document.createElement('tr');
		tr.style.backgroundColor = 'inherit';
		tr.style.borderWidth = 0;
		tr.classList.add('psc-trendsurfer\/Tooltip\/item');

		const td = document.createElement('td');
		td.style.borderWidth = 0;

		const text = document.createTextNode(itemText);

		td.appendChild(colorBlock);
		td.appendChild(text);
		tr.appendChild(td);

		return tr;
	};
	const getCssStyle = (element, prop) => {
		return window.getComputedStyle(element, null).getPropertyValue(prop);
	}

	const getTextWidth = (text, font) => {
		const canvas = context.chart.canvas;
		const ctx = canvas.getContext('2d');
		ctx.font = font;
		const metrics = ctx.measureText(text);
		return metrics.width;
	}

	const getCanvasFont = (el) => {
		const fontWeight = getCssStyle(el, 'font-weight') || 'normal';
		const fontSize = getCssStyle(el, 'font-size') || '16px';
		const fontFamily = getCssStyle(el, 'font-family') || 'Times New Roman';

		return `${fontWeight} ${fontSize} ${fontFamily}`;
	}

	const createTooltipHeader = (titleLines) => {

		const tableHead = document.createElement('thead');

		titleLines.forEach(title => {
			const tr = document.createElement('tr');
			tr.style.borderWidth = 0;

			const th = document.createElement('th');
			th.style.borderWidth = 0;
			const text = document.createTextNode(title);

			th.appendChild(text);
			tr.appendChild(th);
			tableHead.appendChild(tr);
		});
		return tableHead;

	};

	const {chart, tooltip} = context;
	const usedScales = [];
	const itemsByParent = {};
	var widestTTItem = 0;
	let widthPadding = 0;

	if (!tooltip || !tooltip.dataPoints) {return};

	tooltip.dataPoints.forEach( (element, ndx) => {
		let scaleId = element.dataset.yAxisID || 'y';
		let colors = tooltip.labelColors[ndx];
		let itemText = tooltip.body[ndx].lines;

		let itemWidth = getTextWidth(itemText, getCanvasFont(document.body));
		itemWidth + tooltip.options.boxWidth + 4 + 10
		if (itemWidth > widestTTItem) {widestTTItem = itemWidth;};

		if (!usedScales.includes(scaleId)) {
			usedScales.push(scaleId);
		};

		if (!(scaleId in itemsByParent)) {
			itemsByParent[scaleId] = [];
		};
		let ttItem = createTooltipItem(colors, itemText, tooltip.options);
		itemsByParent[scaleId].push(ttItem);

	});

	var flipTipSide = false;
	const caretSize = tooltip.options.caretSize;
	const {offsetLeft: positionX, offsetTop: positionY} = chart.canvas;
	const maxWidth = widestTTItem + (2 * tooltip.options.padding) + 5

	// Final cleanup, sizing, and placment loop through the tooltip boxes
	usedScales.forEach( (element, ndx) => {

		let toolTipEl = getOrCreateTooltip(chart, element);
		toolTipEl.style.padding = tooltip.options.padding + 'px ' + tooltip.options.padding + 'px';
		toolTipEl.style.minWidth = maxWidth + 'px'
		//toolTipEl.style.width = maxWidth + 'px';

		// Get or create tooltip item table
		let ttTable = toolTipEl.querySelector("table");
		if (!ttTable) {
			ttTable = document.createElement("table");
			ttTable.classList.add("psc-trendsurfer\/Tooltip\/table");
			toolTipEl.append(ttTable);
		};

		// Get or create tooltip table body
		let tBody = ttTable.querySelector('tbody');
		if (!tBody) {
			tBody = document.createElement('tbody');
			ttTable.append(tBody);
		};

		let scale = chart.scales[element] || null;
		if (!scale) {return};

		// Drop all children of table
		tBody.replaceChildren();


		// Hide tooltip if not being shown
		if (tooltip.opacity === 0) {
			toolTipEl.style.opacity = 0;
			return;
		};

		// Then add all new children
		let newChildren = itemsByParent[element];
		tBody.replaceChildren(...newChildren);

		// Determine tooltip placement side (left or right of xTrace line)
		let expectedX = positionX + tooltip.caretX + caretSize;
		let expectedY = (scale.top + 20);
		let expectedRight = expectedX + maxWidth + 5;

		toolTipEl.style.opacity = 1;
		toolTipEl.style.top = (scale.top + 20) + 'px';


		if (expectedRight >= chart.chartArea.right) {
			flipTipSide = true;
			return;
		};

		toolTipEl.style.left = positionX + tooltip.caretX + caretSize + (maxWidth/2) + 'px';
	});

	if (flipTipSide) {
		usedScales.forEach( (element) => {
		const toolTipEl = chart.canvas.parentNode.querySelector('div #tt_'+ element);
		toolTipEl.style.left = positionX + tooltip.caretX - caretSize - (maxWidth/2) + 'px';
	})};
}