Brief backstory:
About 4 years ago we developed an MES system using Ignition. It was developed solely by one guy, who is not with our company anymore. Within the past 2-3 months we've been having lots of problems with OPC connections dropping out, as well as sometimes very slow opc tag reads/writes. It is really hurting our production numbers right now, and I've finally been given access to our ignition server and have been tasked with figuring out what is causing these disconnects and slow downs. I should also add that this problem has always existed, just not at the severity we are seeing lately. I have very little experience with ignition, but I learn quick and I am open to any suggestions. I will attempt to provide as much detail as possible, but if more is needed I will be happy to acquire it.
Our system:
We are using Ignition 8.0.14. Ignition is connected to a total of 13 PLC's, Of those PLCs we have 4 Omron NX102-9020, and 9 Siemens S7 300 series. On the Omron side, we have a total of 56 tags, being polled at a rate of 800 ms. On the Siemens side, we have a total of 763 tags, being polled at a rate of 1000 ms. We are using the Omron NJ driver (3.0.14) and the Siemens driver (5.0.14)
The communication drop out and slow downs are being seen on every device. These disconnects and slow downs appear random. We have yet to see a pattern to when and where they will happen. I myself am more experienced with Omron, so I was able to setup some tags to run some tests using the Omron PLCs and ignition. I setup a variable inside of an omron plc called gMES_Debug. I then setup a script in ignition so that on valueChange, ignition simply writes the tag back to 0. Inside of the PLC I am timing how long this transistion from 0 --> 1 --> 0 takes, effectively timing the tag read/write speeds of the opc connection. The tag is set to update at 800ms. I get timings back anywhere from 200ms - to >60s. It is random.
At this point my questions are the following. Are there any logs any where that might tell me why these connections are dropping out. Rather it be a simple timeout, or the plc refusing the connection. Also, is there anything any where that might tell me why these read/writes are sometimes taking long times.
I feel like there are quite a few routes this could go, so I'm unfortunately going to shotgun a few ideas that may have been looked at already and see if it brings any ideas or information to guide future questions. Based on what is described, I'd be looking at gateway or network resources to see if there is bottlenecks.
First I'd look at gateway status home page for potential high memory/CPU issues or Clock Drift errors.
Any errors in the wrapper log file in program files that seem related? Or in the logs on the status page? (C:\Program Files\Inductive Automation\Ignition\logs)
Any new devices added to this network around the time these issues started? Ignition connected or otherwise?
Is the server used for anything else that could be occupying resources?
Depending on how you are reading/writing those tags, the threads page under status might be useful too. Can see if sql-bridge or tag-events are holding up other events.
If its urgent, probably worth reaching out to IA support for official support, but hopefully these maybe can point you in a direction or provide some more information to people to ask further questions.
I'm not seeing any unusually high loads on the gateway. Not sure about clock drift errors, how do I check that?
I will have to get someone with more access then me to retrieve these logs. I'm unable to get into the physical server with my credentials. I will look into it.
No new devices added, however, interestingly enough there were 16 devices removed at around the time the issues started. Those 16 connections are disabled inside of the gateway.
I believe the server is also handling a lot of database queries. But the query times are miniscule compared to the delay I'm seeing in read/write times.
I also forgot to mention. I installed ignition to my local machine and ran the same gMES_Debug test on it. I had absolutely zero problems with any of the read/writes. They were virtually instant. With that said. I only had a total of like 4 tags subscribed so now where near the load of the true server.
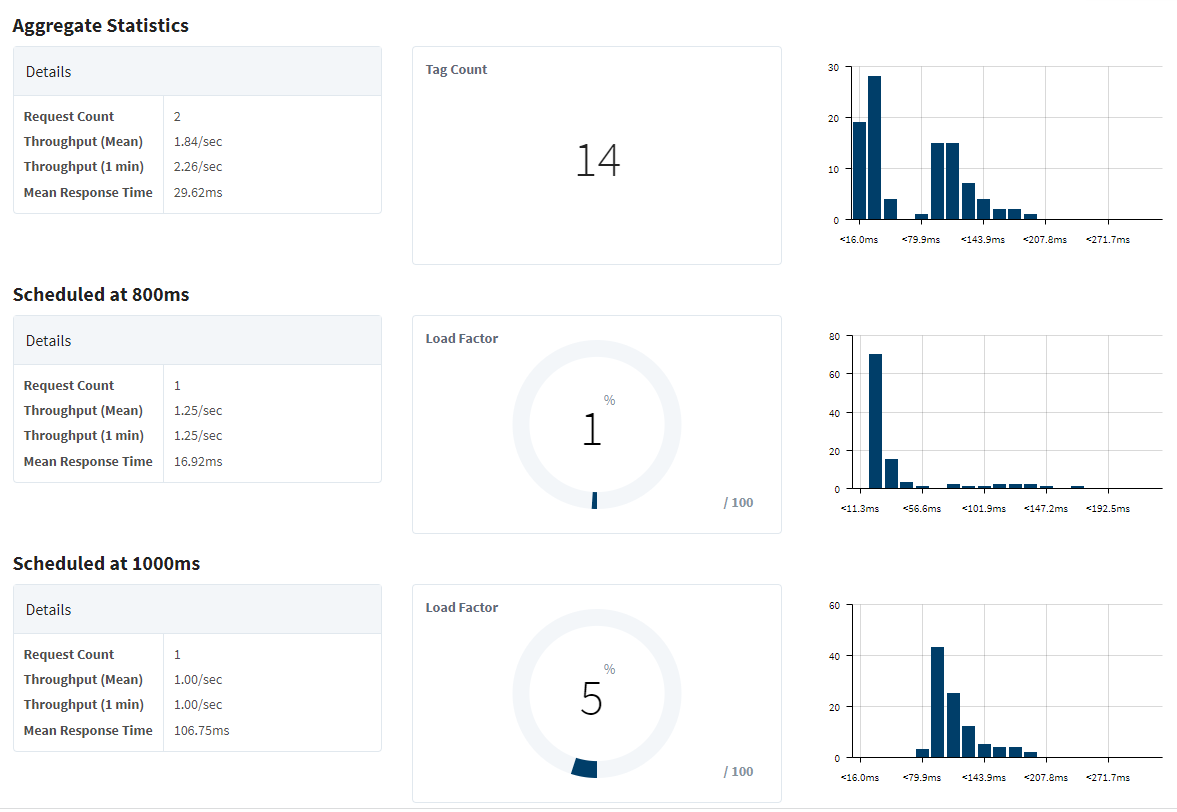
Look at the device status pages for each of your PLCs. Snapshot for us. In particular, what are the typical PLC response times? How many requests are in each subscription group? Do the status pages show any overload?
Meanwhile, please describe the network topology. Is your Ignition server directly connected to the production LAN? If not, why not? (PLC native protocols are highly sensitive to network latency--WAN connections are killers.)
I will work on retrieving the status snapshots. In the mean time yes, our server is centrally located and connected directly to the plant network. Our network is segregated into multiple vlans. Office, shipping, assembly, shipping, machining. The server has firewall access to all associated vlans. The Siemens plcs exist in our machining vlan, and the omron plcs exist in our shipping vlan.
If you click the area with the server resources on the status homepage, it will bring you to a page that looks like this. If there have been any recently, they should show up in the red box. Otherwise in the logs on the status page they should be there as well.
As for other things occupying resources, I was thinking outside of Ignition. Any other programs on the gateway server? Or updates occurring outside of Ignition that could tie up resources?
Those are perfectly normal response times. Your server is extremely lightly loaded. I suspect you are suffering from algorithmic problems. (Like writing tags from two directions.)
(Well, the Omron response times are somewhat long, but I'm not familiar with that model. It's kind of wimpy, if I recall correctly.)
I would be remiss if I didn't mention that your version of Ignition is old and buggy and no longer supported. (v8.0.x was never a Long-Term-Support version.) You should consider upgrading to the v8.1 line.
Yes, its one of their lightweight models. Its perfectly capable for the machine they are running as its not doing much. At this point, if we wasn't also having problems on our Siemans machines then I might tease the idea of the PLC being at fault. I would also like to remind you that these read/writes weren't always this slow either. Something happened when we removed those 16 plcs from ignition. Once those were removed, and scripts/queries were rewritten then the problems set in.
Yeah, those all look pretty decent overall. I'd either say whatever is causing the issue isn't occurring right now or there's something specific to the logic/configuration that isn't showing up in these particular stats. (I am noting that you have some higher thread 'timed waiting' count on that performance screen than most gateways I can reference right now, but might not be a sign of an issue depending on what threads they are)
One more question, though I think it probably would still show in the gateway a bit if it were related. Physical or virtual server? and if virtual, how are the resources setup? If its a shared resource pool, that could cause a bottleneck too.
Problems with virtual servers are common. Ignition normally runs with a light CPU load, and needs to, to keep response times down. Many hypervisor platforms see that utilization pattern and shift CPU time to other servers behind Ignition's back. That is trouble. It is especially disruptive if the DB is a server on the same hypervisor, as heavy queries might move CPU time to the DB at the Ignition gateway's expense.
There's also the phenomenon where IT takes a backup of your servers where they are paused for several seconds while the disk images are taken. After that, Ignition wakes back up and all your network comms are broken.
You should investigate your hypervisor. IA generally recommends using physical hardware, not virtual. I don't entirely agree with that, but that policy does eliminate a whole host of ways IT can disrupt your system.
I wrote a script triggered on the valueChange of gMES_Debug. It looks like this...
I added a new varaible called gMES_Debug_Echo to the plc and updated ignition with the new tag. The script simply looks for a value change on gMES_Debug, then echo's it back to gMES_Debug_Echo in the PLC. Nothing else is writing to the variable inside of the plc. I've cycle it 10 times with a timer to track execution inside of the plc. My logic looks like this...