I run into this problem frequently on the Perspective PowerChart with trended discrete tags that do not change values very often (such as setpoints and booleans) where if the time range is set too high and the point count is too low, the chart will often miss the last change of value. See video below where zooming in and out causes the value to change.
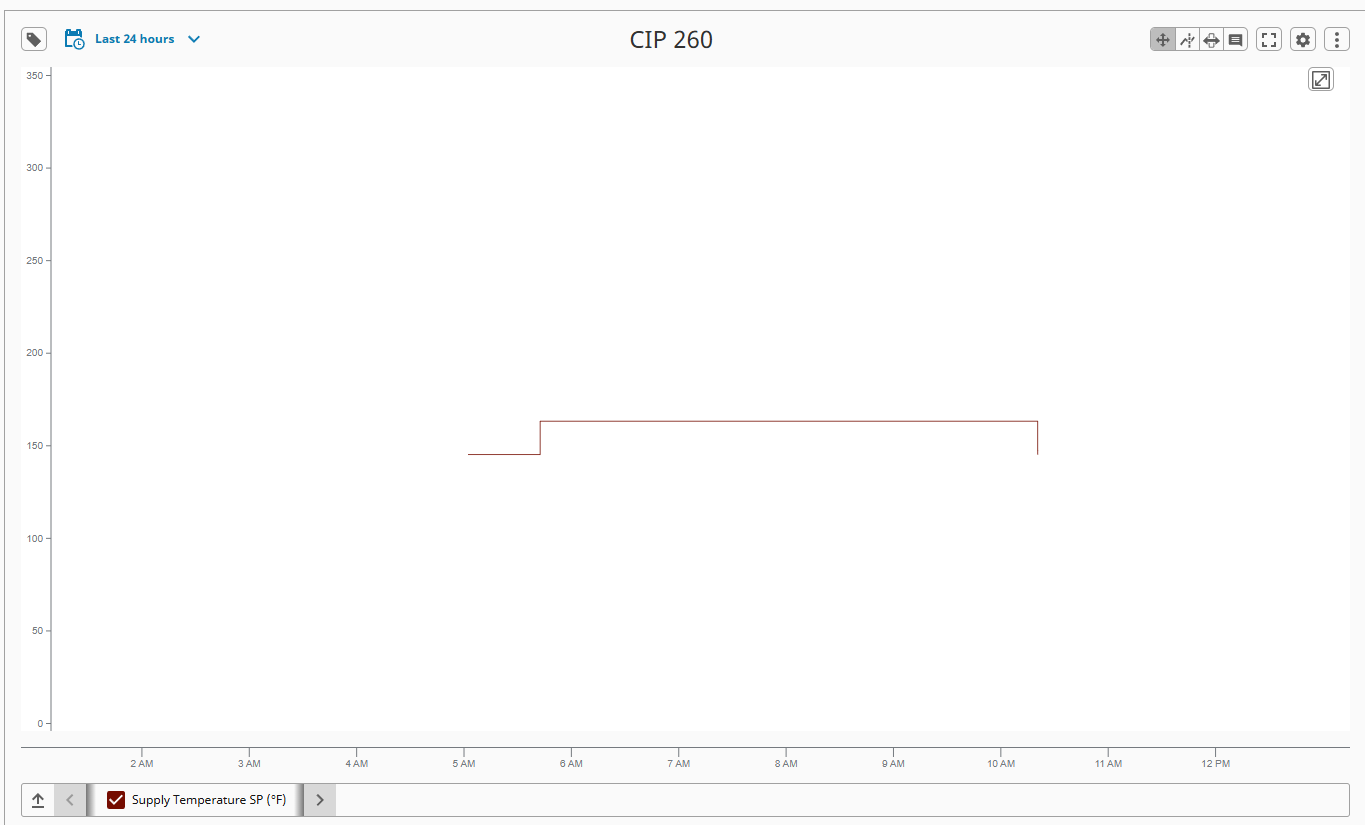
I’ve found I can ‘fix‘ it by setting the point count to -1 (although this has another undesirable effect of breaking the line at the start/end where there is no data point, see image below), but unfortunately these tags share charts with analog tags where the compression is necessary. I would also prefer not to lower the max time between samples in the tag historian if possible.
I guess what I would like is a way to set different point counts for pens. Has anyone got another work around?