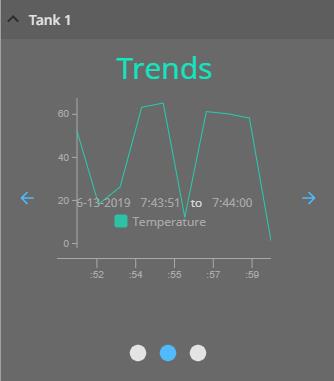
Added a time series graph and configured the animation to be on. Modified trends and axis to decrease the space between edge of component and y axis. How ever , while the component sits on a Carousel , transitioning to the pane containing said component displays time range and legend in the middle of the graph.
@ppatel1, I’ve got a bug logged about initial display issues when using the legend on the Time Series Chart. I would wager to guess that is causing your issue. If you hide the legend, do you still see this behavior? If so, you may want to keep the legend hidden until I can get a fix out for this.