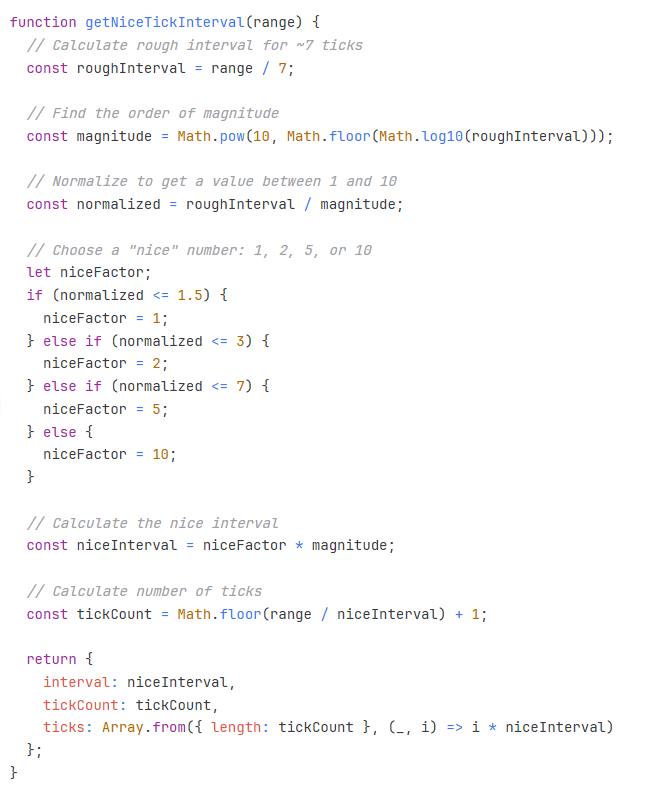
This seems to work ok for a number of ranges. Copy the JSON below and paste it into a View and have a look at the custom props and the bindings on the axes
[
{
"type": "ia.chart.timeseries",
"version": 0,
"props": {
"series": [
{
"name": "Boiler",
"data": [
{
"time": 1560469431423,
"Temperature": 52,
"Pressure": 12
},
{
"time": 1560469432423,
"Temperature": 18,
"Pressure": 42
},
{
"time": 1560469433423,
"Temperature": 26,
"Pressure": 81
},
{
"time": 1560469434423,
"Temperature": 63,
"Pressure": 11
},
{
"time": 1560469435423,
"Temperature": 65,
"Pressure": 23
},
{
"time": 1560469436423,
"Temperature": 12,
"Pressure": 43
},
{
"time": 1560469437423,
"Temperature": 61,
"Pressure": 71
},
{
"time": 1560469438423,
"Temperature": 60,
"Pressure": 89
},
{
"time": 1560469439423,
"Temperature": 58,
"Pressure": 66
},
{
"time": 1560469440423,
"Temperature": 1,
"Pressure": 33
}
]
}
],
"plots": [
{
"relativeWeight": 1,
"trends": [
{
"visible": true,
"type": "line",
"series": "Boiler",
"interpolation": "curveLinear",
"breakLine": true,
"stack": true,
"radius": 2,
"axis": "default",
"columns": [],
"baselines": []
}
],
"axes": [
{
"name": "default",
"alignment": "left",
"width": 60,
"label": {
"visible": true,
"text": "",
"offset": 0,
"font": {
"color": "",
"size": 10
},
"style": {
"classes": ""
}
},
"tick": {
"color": "",
"label": {
"format": "d",
"font": {
"color": "",
"size": 10
},
"style": {
"classes": ""
}
},
"style": {
"classes": ""
}
},
"grid": {
"visible": true,
"color": "#2b2b2b",
"opacity": 0.1,
"dashArray": 0,
"style": {
"classes": ""
}
},
"style": {
"classes": ""
}
}
],
"markers": []
}
]
},
"meta": {
"name": "TimeSeriesChart"
},
"position": {
"basis": "400px"
},
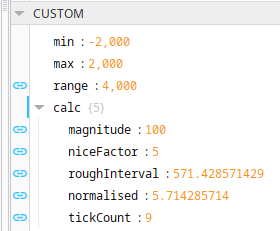
"custom": {
"min": -2000,
"max": 2000,
"calc": {}
},
"propConfig": {
"props.plots[0].axes[0].tick.count": {
"binding": {
"type": "expr",
"config": {
"expression": "{this.custom.calc.tickCount}"
}
}
},
"custom.range": {
"binding": {
"type": "expr",
"config": {
"expression": "{this.custom.max} - {this.custom.min}"
}
}
},
"props.plots[0].axes[0].min": {
"binding": {
"type": "property",
"config": {
"path": "this.custom.min"
}
}
},
"props.plots[0].axes[0].max": {
"binding": {
"type": "property",
"config": {
"path": "this.custom.max"
}
}
},
"custom.calc.roughInterval": {
"binding": {
"type": "expr",
"config": {
"expression": "{this.custom.range} / 7"
}
}
},
"custom.calc.magnitude": {
"binding": {
"type": "expr",
"config": {
"expression": "pow(10, floor(log10({this.custom.calc.roughInterval})))"
}
}
},
"custom.calc.normalised": {
"binding": {
"type": "expr",
"config": {
"expression": "{this.custom.calc.roughInterval} / {this.custom.calc.magnitude}"
}
}
},
"custom.calc.niceFactor": {
"binding": {
"type": "expr",
"config": {
"expression": "if({this.custom.calc.normalised} <= 1.5, 1,\r\nif({this.custom.calc.normalised} <= 3.0, 2,\r\nif({this.custom.calc.normalised} <= 7.0, 5,\r\n10)))"
}
}
},
"custom.calc.tickCount": {
"binding": {
"type": "expr",
"config": {
"expression": "floor({this.custom.range} / ({this.custom.calc.niceFactor} * {this.custom.calc.magnitude})) + 1"
}
}
}
}
}
]
Claude helped a bit - see the original below
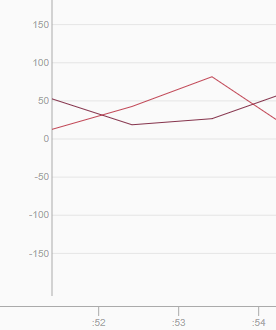
It could do with some tweaking for some ranges like 150, 75