Hi All
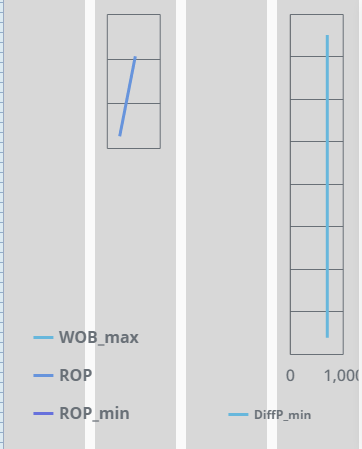
I’m having a hard time getting the XY charts to display completely in the given space on a column container. This is what I’m seeing after disabling the Y-axis.
Is there anything in what I’m doing wrong? Thanks in advance.
Hi All
I’m having a hard time getting the XY charts to display completely in the given space on a column container. This is what I’m seeing after disabling the Y-axis.
Is there anything in what I’m doing wrong? Thanks in advance.