My client is trying to replicate the subplot functionality (and others) using the XY Chart in Perspective. Is there a way to create subplots in Perspective?
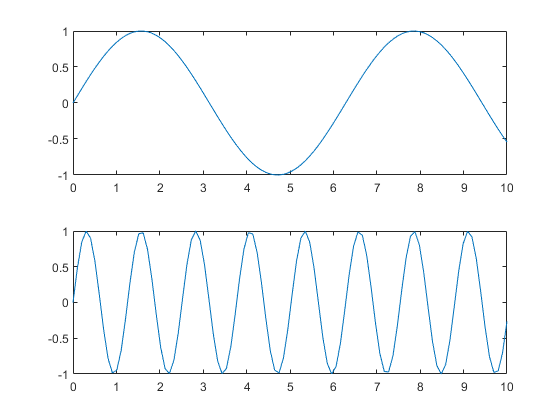
subplot as in MATLAB’s subplots? Like this?
Seems to me like your best bet would be to place multiple XY Charts inside of a Flex container, Perspective doesn’t seem to support anything like this by default.

You could emulate that in Perspective by having multiple XY Charts in a Flex container (with the Flex container having a column direction), and then hide the X axes on all but the bottom “subplot”.
I wouldn’t go overboard before IA picks a replacement charting library.
I smell what you are stepping in, however, does that mean the XY chart is going to be completely different than what I am using now? I need to deliver a SCADA system to my client soon. Am I wasting my time trying to stumble through this and deliver something only for it to be obsolete in the near future? Any insight would be appreciated! Thank you-
The existing XY chart won’t be going away - as far as I know, the plan is to “deprecate” it in a similar manner to the way various Vision components have been deprecated over time. So, any existing components will still work – you just won’t be able to create a new one from the component pallet.
Even if it will become obsolete (and seems likely), it's not wasted time if your customer needs it. But they may need to pay to re-implement parts of the project to move to the new chart implementation when upgrading later. It's definitely a sticky situation.
I was expecting this, but it is good to hear it from you.
Ok- good to know, thanks. And now for the all important question- Is there a time frame for the “new” XY Chart component to be released?
Soon  . Ideally, 8.0.3 - but we’d rather release a good chart than (another) somewhat broken one, and the release train doesn’t stop for anybody
So will a different library to AMCharts be what Perspective uses in the future?
I had asked about AMCharts a while back on the forum, but never got any response, and was wondering about how some AMCharts features and chart types aren’t exposed in Ignition. Is something completely different going to be replacing AMCharts then?
Is there any more details on a replacement charting library? I’d love subplots in the current XY chart.
I can’t use the Timeseries chart which has subplots, because… well… my data isn’t time series. The X axis is in distance.
I was wondering if there was any update on the subplot feature to the Perspective XY Chart component?
I have previously used the Time-Series Chart and the Power Chart for several applications in order to make use of the subplots, but I am in need of creating embedded trends where some use a category axis vice just a value axis, and having their x-axis (timestamp) align. Dropping three XY Charts in a flex container together will not really allow for any x-axis alignment. Is there a way to accomplish this without using a 3rd-party trending module?
