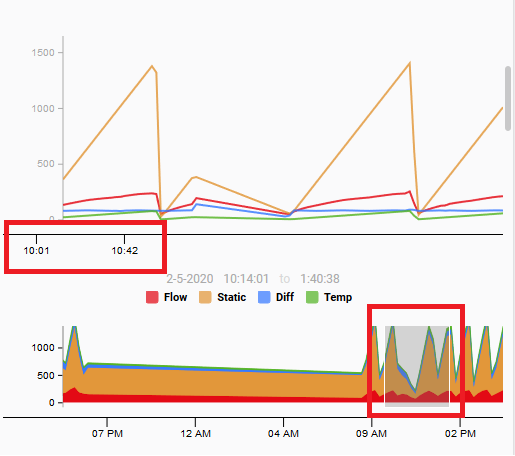
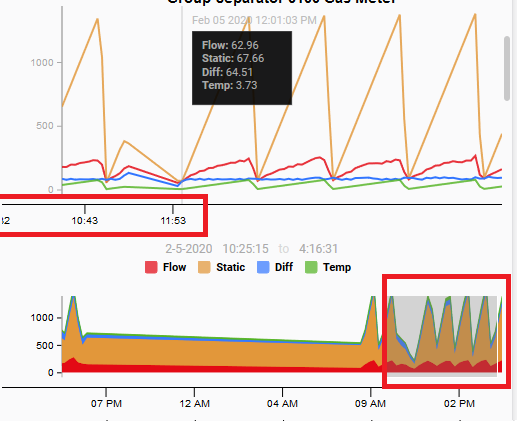
I have noticed a possible glitch when using the Chart Range Selector to control the Start/End Time of the Time Series Chart. When selecting a range via the CRS, the time axis/tickers on the TSC seem to occasionally act up/glitch - as in they may go to the far left of the TSC or half may be missing as shown in the screenshots below.
Is this something you have seen before? If so is there a solution you can recommend?
Hi @jaspinall, that’s definitely not something that we’ve seen before. What version of ignition are you using? There was an update made in the 8.0.7 that gave absolute precision to the number of ticks given to the X axis which may have indirectly solved this. May be worth upgrading to see if that resolves your issue. If not, please post back.