Hi Guys,
I am using power chart i have selected historical mode
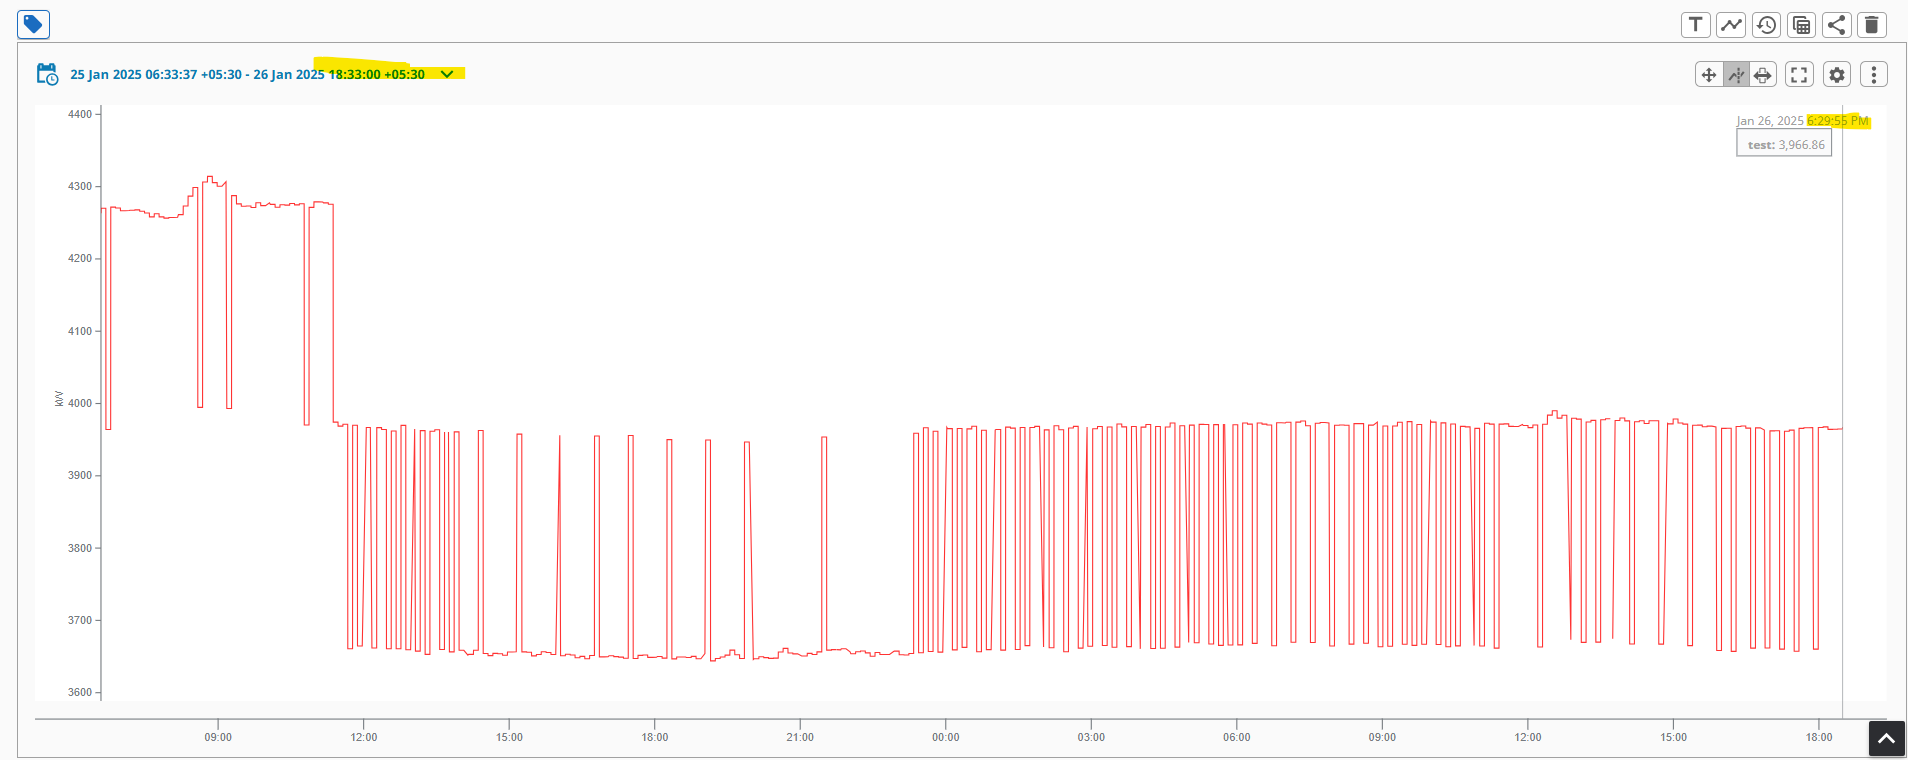
I have noticed it its showing -10 or -5 mins offset from the actual end time in chart. Its happening most of the tags
I couldn't able to find out the reason for the issue. can you please help me out
My actual end time is 6:33pm but its showing data up to 6:29pm when i export the file also its showing up to 6:29
Point count i mentioned -1
Have you confirmed there's data actually recorded in the raw tables for the last few minutes that seem to be missing? Is 18:33 in the screenshot the current time at the time of the screenshot? or is it in the past?
I would start by querying that set of data through the script console or into a table on a view and then match up the timestamps.
The other thing you could look at is how you are doing the timezone conversion on your historical selection. 06:33:37 +05:30.
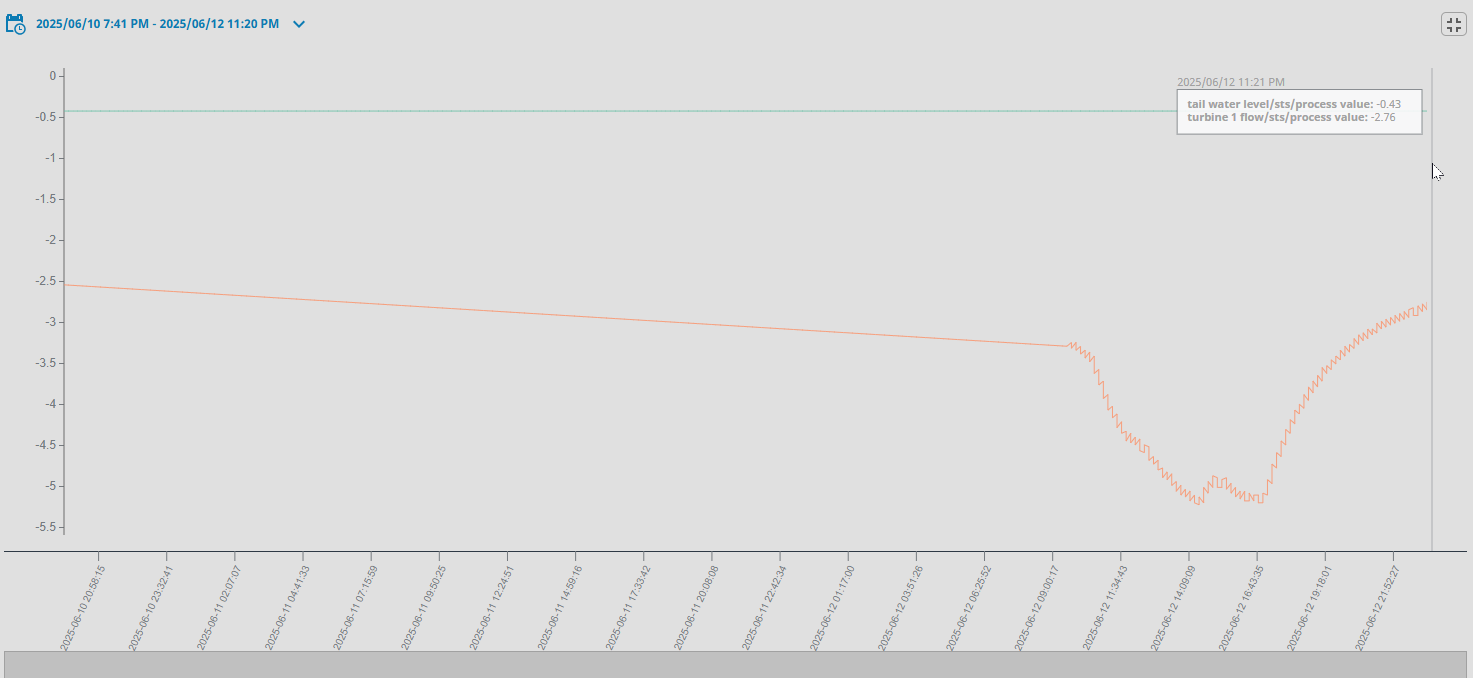
Actually, I'm seeing the same thing...
The pen display ends around 23:11 instead of 23:20 which is the historical period end. It's currently 23:50, and there is definitely data from 23:11 to 23:20.
As a side note, gotta love those datetime values... 20:08:08, 22:32:44, ... what kind of increments are they??
yes data is there for 6:29 then next data in database is 6:35. May be that's y its not showing data in export file
One more question if i give point of count 300, then iit should interpolate and show up to 6:33?
I have given 300 point of count, now its showing up to 6:26 only
I am just mentioning current time zone in that label