Hello everyone, I encountered the following issue while using PowerChart:
When I clicked to insert a label into a component, a component error was reported in the real-time chart.
When I switch to historical mode, it displays normally. I can see that the historical data for this tag is a straight line, at which point I realized that this data has not changed. So I expanded the legend.
When I switch back to real-time mode, the other data that changes in real-time displays normally, while the data that has not changed shows no corresponding trend data.
I believe the normal display should also be a straight line, right? (In the tag group, I set both real-time and historical tags to save or collect data once per second, as shown in the image.)
This issue occurs quite frequently. How would you suggest resolving it in this situation?
I put my components below.If you need any additional information to help resolve the issue, please let me know.


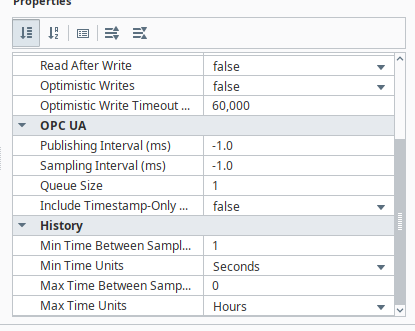
Chart Repeater
[
  {
    "type": "ia.display.flex-repeater",
    "version": 0,
    "props": {
      "path": "Template/AnalyzeChart",
      "instances": [
        {
          "paramType": 1,
          "paramUnit": "",
          "title": "",
          "tagInfo": [
            {
              "path": "Coater3/Coating1/KeyParams/CoatingPressure",
              "code": "CoatingPressure",
              "provider": "Tag_Server_03"
            }
          ]
        }
      ],
      "direction": "column",
      "useDefaultViewWidth": false
    },
    "meta": {
      "name": "ChartList"
    },
    "position": {
      "grow": 1
    },
    "custom": {},
    "propConfig": {
      "props.instances": {
        "binding": {
          "config": {
            "path": "../TagTree.custom.data"
          },
          "type": "property"
        },
        "persistent": true
      }
    }
  }
]
My Chart Component
[
{
"type": "ia.container.flex",
"version": 0,
"props": {
"direction": "column",
"style": {
"backgroundColor": "#FFFFFF"
}
},
"meta": {
"name": "root"
},
"position": {},
"custom": {},
"children": [
{
"type": "ia.container.coord",
"version": 0,
"props": {
"mode": "percent"
},
"meta": {
"name": "FlexContainer_Chart"
},
"position": {
"grow": 1,
"basis": "300px"
},
"custom": {},
"children": [
{
"type": "ia.chart.powerchart",
"version": 0,
"props": {
"config": {
"unitOfTime": 5,
"measureOfTime": "minutes",
"responsiveDesignWidth": 0,
"visibility": {
"buttons": {
"showTagBrowserButton": false,
"showPanZoomButton": false,
"showXTraceButton": false,
"showRangeBrushButton": false,
"showAnnotationButton": false,
"showFullscreenButton": false,
"showSettingsButton": false
}
},
"export": {
"dateFormat": "YYYY/MM/DD",
"timeFormat": "HH:mm:ss:SSS"
}
},
"interaction": {
"mode": "xTrace",
"panAndZoom": {
"freeRange": true
},
"xTrace": {
"infoBox": {
"timeFormat": "HH:mm:ss"
}
},
"chartZoomLevel": 1,
"rangeZoomLevel": 1
},
"axes": [
{
"color": "#FFFFFF",
"dataFormat": "#,###.##",
"grid": {
"color": "#C9CDD4",
"dashArray": 10,
"opacity": 0.9,
"style": {
"classes": ""
},
"visible": true
},
"label": {
"font": {
"color": "#757A7F",
"size": 10
},
"offset": 0,
"style": {
"classes": ""
},
"text": ""
},
"name": "valueAxis",
"position": "left",
"range": {
"auto": true,
"max": "",
"min": ""
},
"style": {
"classes": ""
},
"tick": {
"color": "#FFFFFF",
"count": "Auto",
"label": {
"font": {
"color": "#757A7F",
"size": 10
},
"format": "Auto",
"style": {
"classes": ""
}
},
"style": {
"classes": ""
}
},
"width": 60
}
],
"plots": [
{
"relativeWeight": 1,
"color": "#FFFFFF",
"markers": [],
"style": {
"classes": "",
"backgroundColor": "#D90000"
}
}
],
"dataColumns": {
"penControl": {
"axis": false,
"plot": false,
"xTrace": false
}
},
"title": {
"visible": true,
"style": {
"alignSelf": "center"
}
},
"timeAxis": {
"height": 62,
"tick": {
"label": {
"format": "h:mm:ss"
}
}
},
"legend": {
"visible": true
},
"style": {
"backgroundColor": "#FFFFFF",
"borderStyle": "none"
}
},
"meta": {
"name": "Chart"
},
"position": {
"height": 1,
"width": 1
},
"custom": {
"key": "value"
},
"propConfig": {
"meta.visible": {
"binding": {
"config": {
"path": "../MultiStateButton.props.controlValue"
},
"transforms": [
{
"fallback": true,
"inputType": "scalar",
"mappings": [
{
"input": 2,
"output": false
}
],
"outputType": "scalar",
"type": "map"
}
],
"type": "property"
}
},
"props.config.endDate": {
"binding": {
"config": {
"expression": "now(0)"
},
"type": "expr"
}
},
"props.config.mode": {
"binding": {
"config": {
"path": "../MultiStateButton.props.controlValue"
},
"transforms": [
{
"fallback": "",
"inputType": "scalar",
"mappings": [
{
"input": 0,
"output": "realtime"
},
{
"input": 1,
"output": "historical"
},
{
"input": 2,
"output": ""
}
],
"outputType": "scalar",
"type": "map"
}
],
"type": "property"
}
},
"props.config.pointCount": {
"binding": {
"config": {
"path": "../MultiStateButton.props.controlValue"
},
"transforms": [
{
"fallback": "",
"inputType": "scalar",
"mappings": [
{
"input": 0,
"output": -1
},
{
"input": 1,
"output": 3000
},
{
"input": 2,
"output": ""
}
],
"outputType": "scalar",
"type": "map"
}
],
"type": "property"
}
},
"props.config.startDate": {
"binding": {
"config": {
"expression": "addHours(now(0),-4)"
},
"type": "expr"
}
},
"props.pens": {
"binding": {
"config": {
"path": "view.params.tagInfo"
},
"transforms": [
{
"code": "\tpens = []\n\tdata = value\n\tcolors = self.view.custom.colors\n\txpath = utils.ConstantUtil.getHistoryProvider(self.session.custom.provider)\n\tfor idx, item in enumerate(data):\n\t path = item['path']\n\t provider = item['provider']\n\t tagNameCN = item['code']\n\t\n\t color_obj = colors[idx % len(colors)]\n\t stroke_color = color_obj[\"color\"]\n\t fill_color = color_obj[\"color\"]\n\t\n\t pen = {\n\t \"name\": tagNameCN,\n\t \"visible\": True,\n\t \"enabled\": True,\n\t \"selectable\": False,\n\t \"axis\": \"valueAxis\",\n\t \"plot\": 0,\n\t \"display\": {\n\t \"type\": \"line\",\n\t \"interpolation\": \"curveLinear\",\n\t \"breakLine\": True,\n\t \"radius\": 3,\n\t \"styles\": {\n\t \"normal\": {\n\t \"stroke\": {\n\t \"color\": stroke_color,\n\t \"width\": 2,\n\t \"opacity\": 0.8,\n\t \"dashArray\": 0\n\t },\n\t \"fill\": {\n\t \"color\": fill_color,\n\t \"opacity\": 0.8\n\t }\n\t },\n\t \"highlighted\": {\n\t \"stroke\": {\n\t \"color\": stroke_color,\n\t \"width\": 1,\n\t \"opacity\": 1,\n\t \"dashArray\": 0\n\t },\n\t \"fill\": {\n\t \"color\": stroke_color,\n\t \"opacity\": 1\n\t }\n\t },\n\t \"selected\": {\n\t \"stroke\": {\n\t \"color\": stroke_color + \"99\",\n\t \"width\": 1,\n\t \"opacity\": 1,\n\t \"dashArray\": 0\n\t },\n\t \"fill\": {\n\t \"color\": stroke_color + \"99\",\n\t \"opacity\": 1\n\t }\n\t },\n\t \"muted\": {\n\t \"stroke\": {\n\t \"color\": stroke_color,\n\t \"width\": 1,\n\t \"opacity\": 0.4,\n\t \"dashArray\": 0\n\t },\n\t \"fill\": {\n\t \"color\": stroke_color,\n\t \"opacity\": 0.4\n\t }\n\t }\n\t }\n\t },\n\t \"data\": {\n\t \"source\": \"histprov:\"+ xpath + \":/tag:\" + path,\n\t \"aggregateMode\": \"default\"\n\t }\n\t }\n\t pens.append(pen)\n\t\n\treturn pens",
"type": "script"
}
],
"type": "property"
}
},
"props.title.text": {
"binding": {
"config": {
"expression": "{view.params.title}"
},
"type": "expr"
}
}
}
},
{
"type": "ia.chart.timeseries",
"version": 0,
"props": {
"series": [
{
"name": "Boiler"
}
],
"title": {
"visible": true
},
"timeAxis": {
"height": 30
},
"timeRange": {
"visible": false,
"dateFormat": "YYYY-M-D",
"timeFormat": "HH:mm:ss"
}
},
"meta": {
"name": "TimeSeriesChart"
},
"position": {
"height": 1,
"width": 1
},
"custom": {},
"propConfig": {
"meta.visible": {
"binding": {
"config": {
"path": "../MultiStateButton.props.controlValue"
},
"transforms": [
{
"fallback": false,
"inputType": "scalar",
"mappings": [
{
"input": 2,
"output": true
}
],
"outputType": "scalar",
"type": "map"
}
],
"type": "property"
}
},
"props.series[0].data": {
"binding": {
"config": {
"path": "view.params.tagInfo"
},
"transforms": [
{
"code": "\ttagPaths = []\n\tdata = value\n\tfor item in data:\n\t\tpath = item['path']\n\t\tprovider = item['provider']\n\t\ttagPath = '[' + provider + ']' + path\n\t\ttagPaths.append(tagPath)\n\t\tendTime = system.date.now()\n\t\tstartTime = system.date.addMinutes(endTime, -20)\n\t\t\n\tdatax = system.tag.queryTagHistory(paths = tagPaths,startDate=startTime, endDate=endTime)\n\treturn datax",
"type": "script"
}
],
"type": "property"
}
},
"props.title.text": {
"binding": {
"config": {
"expression": "{view.params.title}"
},
"type": "expr"
}
}
}
},
{
"type": "ia.input.multi-state-button",
"version": 0,
"props": {
"states": [
{
"text": "Real-Time",
"value": 0,
"selectedStyle": {
"classes": "",
"backgroundColor": "#080808",
"borderBottomLeftRadius": 20,
"borderBottomRightRadius": 20,
"borderStyle": "none",
"borderTopLeftRadius": 20,
"borderTopRightRadius": 20,
"color": "#ffffff"
},
"unselectedStyle": {
"classes": "",
"backgroundColor": "#f2f3f5",
"borderBottomLeftRadius": 20,
"borderBottomRightRadius": 20,
"borderStyle": "none",
"borderTopLeftRadius": 20,
"borderTopRightRadius": 20,
"color": "#080808"
}
},
{
"selectedStyle": {
"backgroundColor": "#080808",
"borderBottomLeftRadius": 20,
"borderBottomRightRadius": 20,
"borderStyle": "none",
"borderTopLeftRadius": 20,
"borderTopRightRadius": 20,
"classes": "",
"color": "#ffffff"
},
"text": "Historical",
"unselectedStyle": {
"backgroundColor": "#f2f3f5",
"borderBottomLeftRadius": 20,
"borderBottomRightRadius": 20,
"borderStyle": "none",
"borderTopLeftRadius": 20,
"borderTopRightRadius": 20,
"classes": "",
"color": "#080808"
},
"value": 1
},
{
"selectedStyle": {
"backgroundColor": "#080808",
"borderBottomLeftRadius": 20,
"borderBottomRightRadius": 20,
"borderStyle": "none",
"borderTopLeftRadius": 20,
"borderTopRightRadius": 20,
"classes": "",
"color": "#ffffff"
},
"text": "Mov. ave.",
"unselectedStyle": {
"backgroundColor": "#f2f3f5",
"borderBottomLeftRadius": 20,
"borderBottomRightRadius": 20,
"borderStyle": "none",
"borderTopLeftRadius": 20,
"borderTopRightRadius": 20,
"classes": "",
"color": "#080808"
},
"value": 2
}
],
"orientation": "row",
"buttonGap": 1,
"endButtonCornerRadius": 20,
"style": {
"backgroundColor": "#f2f3f5",
"borderBottomLeftRadius": 20,
"borderBottomRightRadius": 20,
"borderTopLeftRadius": 20,
"borderTopRightRadius": 20
},
"controlValue": 0
},
"meta": {
"name": "MultiStateButton"
},
"position": {
"x": 0.6839,
"y": 0.0444,
"height": 0.0667,
"width": 0.2544
},
"custom": {},
"propConfig": {
"props.indicatorValue": {
"binding": {
"config": {
"path": "this.props.controlValue"
},
"type": "property"
}
}
}
}
]
}
]
}
]