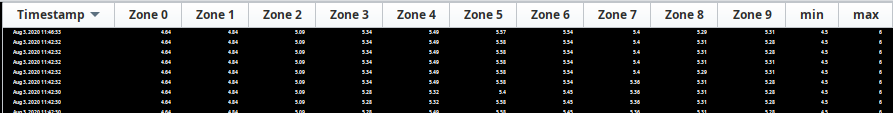
I have a power table that has an issue with the formatting. The table has a column with timestamps, 10 value columns, then 2 limit columns. The configure cell code (below) should reference the limit columns for the value columns. However, it will at times mark all of the value columns as being out of spec.
Something odd, that seems likely to be involved, the minimum and maximum "<>"s need to be reversed from what they should be to display properly when it is working.
Anecdotal observations:
- It shows up sometimes when the window is first started, other times it starts fine.
- It will sometimes show up after running fine for a while.
- It eventually seems to resolve on its own, for a while.
- I have at times been able to query times when it had happened and put that on the table and it showed up again. Other times I have tried and the table looked fine.
Here is the configureCell code, it’s loaded down trying to catch exceptions to figure out what is going on. I have not seen any exceptions with or without the error handling. It ‘thinks’ everything is working fine.
        from java.lang import Exception
	from traceback import format_exc as exc
	try:
		value = float(value)
	except:
		pass
	try:
		# timestamp, min, max columns
		if colIndex in [0, 11, 12]:
			return {'background': 'black','foreground' : 'white'}
		# empty
		elif value is None:
			return {'background': 'black','foreground' : 'white'}
		# zero values
		elif value == 0:
			return {'background': 'black','foreground' : 'grey'}
		# out of spec for min
		elif self.data.getValueAt(rowIndex, 11) > value:
			return {'background': 'red','foreground' : 'blue'}
		# out of spec for max
		elif self.data.getValueAt(rowIndex, 12) < value:
			return {'background': 'red','foreground' : 'blue'}
		# anything else
		else:
			return {'background': 'black','foreground' : 'white'}
	except Exception, e:
		print('java error', exc())
		logr = system.util.getLogger("Lam mahlo chart cell config script")
		logr.info(exc())
		return {'background': 'orange','foreground' : 'green'}
	except:
		print('error', exc())
		logr = system.util.getLogger("Lam mahlo chart cell config script")
		logr.info(exc())
		return {'background': 'orange','foreground' : 'green'}
The columns when everything is within spec.
The columns when something is out of spec.

The columns when things have been going wrong. This is from a video where the formatting is beginning to show properly, from the bottom, one row at a time every few seconds.

Screen captures of it today:

